In this article, we will discuss Matplotlib Arrow() in Python. Matplotlib is a powerful plotting library used for working with Python and NumPy. And for making statistical interference, it is necessary to visualize data, and Matplotlib is very useful. Furthermore, it provides a MATLAB-like interface; the only difference is that it uses Python and is open-source.
Matplotlib Arrow function creates an arrow from one point to another point in a graph. This arrow can be useful to pinpoint graph items and increase the engagement of the graph. Moreover, every arrow has its unique properties to customize it. In this post, we’ll look at the arrow function in detail.
Syntax of Matplotlib Arrow() in python:
matplotlib.pyplot.arrow(x, y, dx, dy, **kwargs)
Parameters:
- x and y are the coordinates of the arrow base.
- dx and dy are the length of the arrow along the x and y-direction, respectively.
- **kwargs are optional arguments that help control the arrow’s construction and properties, like adding color to the arrow, changing the width of the arrow, etc.
- Constructor Arguments for **kwargs: width: float (default: 0.001) – width of full arrow tail
- length_includes_head: bool (default: False) – True if head is to be counted in calculating the length.
- head_width: float or None (default: 3*width) – Total width of the full arrow head
- head_length: float or None (default: 1.5 * head_width) – Length of arrow head
- shape: [‘full’, ‘left’, ‘right’] (default: ‘full’) – Draw the left-half, right-half, or full arrow
- overhang: float (default: 0) – Fraction that the arrow overhangs (0 overhang means triangular shape). Can be negative or greater than one.
- head_starts_at_zero: bool (default: False) – If True, the head starts at coordinate 0 instead of ending at coordinate 0.
Return of Matplotlib Arrow() function:
Returns an Arrow depending on the desired parameters that we provide as inputs.
Plot Arrow using Matplotlib Arrow() in Python
import matplotlib.pyplot as plt

#define two arrays for plotting
A = [3, 5, 5, 6, 7, 8]
B = [12, 14, 17, 20, 22, 27]

#add arrow to plot
plt.arrow(x=4, y=18, dx=2, dy=5, width=.06)

#display plot
plt.show()
Output:
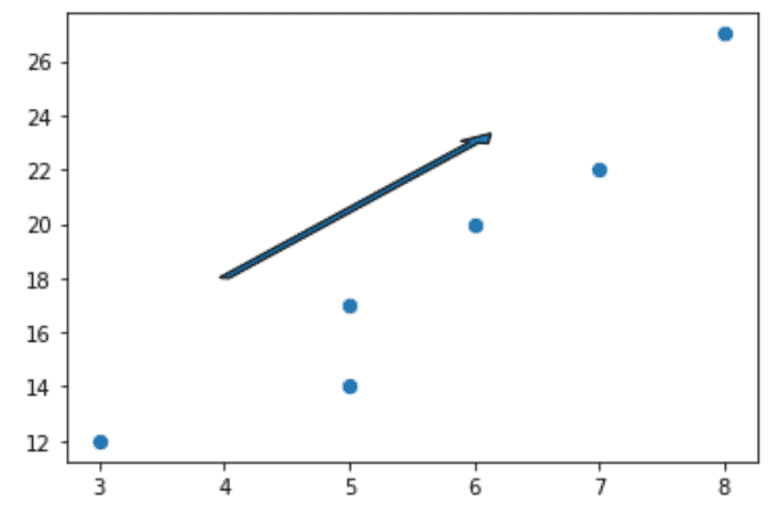
Explanation:
Firstly, an arrow is created where x and y parameters are set to 4 and 8. Setting dx and dy to 2 and 5 creates the length of the arrow. In addition, the width is passed as **kwargs constructor argument, which controls the arrow’s width to be created.
Note: dx is 0 to create a vertical arrow and dy to 0 to create a horizontal arrow.
Arrow styling using Matplotlib Arrow()
import matplotlib.pyplot as plt

#define two arrays for plotting
A = [3, 5, 5, 6, 7, 8]
B = [12, 14, 17, 20, 22, 27]

#add arrow to plot
plt.arrow(x=4, y=18, dx=0, dy=5, width=.08, facecolor='red')

#display plot
plt.show()
Output:

Explanation:
Surprisingly, there are various ways of styling arrows. These different styling properties are applied by passing it as **kwargs argument. To demonstrate, the face color of the arrow being created is set to red. Here we get a vertical arrow as we have set the value of dx to 0.
Adding Annotations to Arrows
import matplotlib.pyplot as plt

#define two arrays for plotting
A = [3, 5, 5, 6, 7, 8]
B = [12, 14, 17, 20, 22, 27]

#add arrow to plot
plt.arrow(x=4, y=18, dx=0, dy=5, width=.08)

#add annotation
plt.annotate('General direction', xy = (3.3, 17))

#display plot
plt.show()
Output:

Explanation:
Annotation, in the simplest form, means adding a text at a point (x, y). To annotate an arrow means adding text around the arrow at a specific x and y coordinate value.
Syntax of Annotate function:
matplotlib.pyplot.annotate(text, xy,*args,**kwargs)
Where text is to be added x and y are the point to annotate and, *args and **kwargs are optional parameters that control annotation properties. To summarize, ‘General direction’ text is added at x = 3.3 and y = 17.
Conclusion
To conclude, this article provides an obvious understanding of Matplotlib arrow() in Python. All are included in this article, from plotting an arrow to styling it and adding annotations. Implementation of arrows in the Python program and examples are also well defined here.
However, if you have any doubts or questions, do let me know in the comment section below. I will try to help you as soon as possible.
Happy Pythoning!
![[Fixed] typeerror can’t compare datetime.datetime to datetime.date](https://www.pythonpool.com/wp-content/uploads/2024/01/typeerror-cant-compare-datetime.datetime-to-datetime.date_-300x157.webp)
![[Fixed] nameerror: name Unicode is not defined](https://www.pythonpool.com/wp-content/uploads/2024/01/Fixed-nameerror-name-Unicode-is-not-defined-300x157.webp)
![[Solved] runtimeerror: cuda error: invalid device ordinal](https://www.pythonpool.com/wp-content/uploads/2024/01/Solved-runtimeerror-cuda-error-invalid-device-ordinal-300x157.webp)
![[Fixed] typeerror: type numpy.ndarray doesn’t define __round__ method](https://www.pythonpool.com/wp-content/uploads/2024/01/Fixed-typeerror-type-numpy.ndarray-doesnt-define-__round__-method-300x157.webp)