
Hello, geeks, and welcome to today’s article; we will cover the Matplotlib draw a rectangle. Along with that, we will also look at its syntax and parameters for a better overall understanding. Then, we will see the application of all the theory parts through a couple of examples.
So, to draw rectangles on the matplotlib plot, we use the function matplotlib patches Rectangle. This function helps us in plotting the rectangular patch with a specific width and height. As we move ahead, things will become a lot clearer to us. We will be looking at the syntax associated with this function, followed by parameters.
Syntax
matplotlib.patches.Rectangle()This is the general syntax for our function. It has several parameters associated with it, which we will cover in the next section of this article.
Parameters
1. xy:
This parameter represents the lower left point from which the rectangle plotting will start.
2. width
Through this parameter, user specifies the width of the rectangle that he or she wants to create.
3. height
Through this parameter, user specifies the height of the rectangle that he or she wants to create.
4. angle
This parameter represents the angle of rotation for the created rectangle.
Examples
As we are done with all the theory portions related to the Matplotlib, draw a rectangle. This section will look at how this function works and how it helps us achieve our desired output. We will start with an elementary-level example and gradually move our way to more complicated examples.
1. How to draw a Rectangle in a Plot
import matplotlib.pyplot as plt
from matplotlib.patches import Rectangle

fig, ax = plt.subplots()
ax.plot([1,5,2],[2,3,4],color="cyan")
ax.add_patch(Rectangle((2, 2), 1, 3,color="yellow"))
plt.xlabel("X-AXIS")
plt.ylabel("Y-AXIS")
plt.title("PLOT-1")

plt.show()

Here, we can see the very first example related to matplotlib patches Rectangle. The primary aim of this example was to get aware of the syntax and how it is executed. To do it, first, we have imported the necessary modules. Then, we created a simple plot and changed its color as per my wish.
Then, to make a rectangle, we have used our functions syntax. Here (2,2) represents the lower-left point from which the rectangle formation will start. Next, we defined 1 and 3 as their width and height for the rectangle. From seeing the output image, it is quite evident that we have executed the program successfully.
2. Draw Matplotlib Rectangle on a scatter plot
import matplotlib.pyplot as plt
from matplotlib.patches import Rectangle

fig, ax = plt.subplots()
ax.scatter([5, 7, 8, 7, 2, 17, 2, 9,
     4, 11, 12, 9, 6],[99, 86, 87, 88, 100, 86,
     103, 87, 94, 78, 77, 85, 86])
ax.add_patch( Rectangle((5, 82.5),
                        5, 7.5,
                        fc='none',
                        color ='yellow',
                        linewidth = 5,
                        linestyle="dotted") )
plt.xlabel("X-AXIS")
plt.ylabel("Y-AXIS")
plt.title("PLOT-2")

plt.show()

Above, we can see an example related to the scatter plot. A scatter plot is commonly seen in statistics. Herewith, with the help of the for function, we have tried to create a boundary between the like points and outliners. Outliners can be understood as points that are a way to be apart from the rest of the data. If taken into consideration, they can hurt the calculation of the value of central tendencies.
To do so, first, we have created a scatter plot. After this, we have used our function as the above example. Here, we have made specific customizations to the function. We have used “fc,” which decides whether the rectangle will be color filled. Then we used the “linewidth” and “line style” parameters to customize the rectangle border.
3. Plotting a Matplotlib Rectangle on an Image
import matplotlib.pyplot as plt
import matplotlib.patches as patches
from PIL import Image
import numpy as np

x = np.array(Image.open('89.jpg'))
plt.imshow(x)

fig, ax = plt.subplots(1)

ax.imshow(x)

rect = patches.Rectangle((500, 1500), 1400, 1300, linewidth=1,
                         edgecolor='r', facecolor="none")

ax.add_patch(rect)
plt.show()
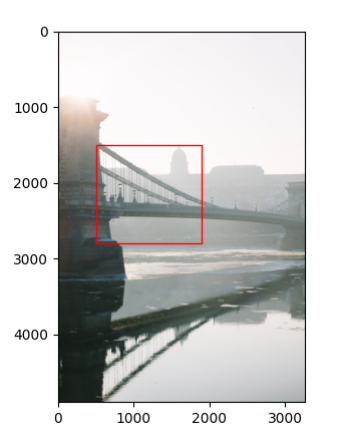
Here, we have successfully created a rectangle on an image. To do so, we have used our function and specified all the parameters we need.
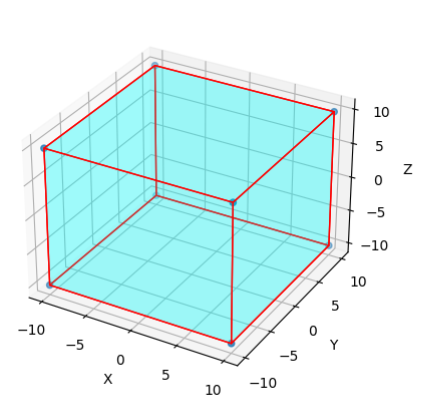
4. Drawing a 3D Rectangle
The essential thing to draw a 3d rectangle is a set of proper coordinates. Using mpl toolkits, you can then plot a 3d rectangle or parallelepiped using the right sets for vertices. Below, you can see the code through which we can create a 3d rectangle
import numpy as np
from mpl_toolkits.mplot3d.art3d import Poly3DCollection, Line3DCollection
import matplotlib.pyplot as plt
points = np.array([[-1, -1, -1],
                  [1, -1, -1 ],
                  [1, 1, -1],
                  [-1, 1, -1],
                  [-1, -1, 1],
                  [1, -1, 1 ],
                  [1, 1, 1],
                  [-1, 1, 1]])
Z = points
Z = 10.0*Z
fig = plt.figure()
ax = fig.add_subplot(111, projection='3d')
r = [-1,1]
X, Y = np.meshgrid(r, r)
ax.scatter3D(Z[:, 0], Z[:, 1], Z[:, 2])
verts = [[Z[0],Z[1],Z[2],Z[3]],
 [Z[4],Z[5],Z[6],Z[7]],
 [Z[0],Z[1],Z[5],Z[4]],
 [Z[2],Z[3],Z[7],Z[6]],
 [Z[1],Z[2],Z[6],Z[5]],
 [Z[4],Z[7],Z[3],Z[0]]]
ax.add_collection3d(Poly3DCollection(verts, facecolors='cyan', linewidths=1, edgecolors='r', alpha=.20))
ax.set_xlabel('X')
ax.set_ylabel('Y')
ax.set_zlabel('Z')
plt.show()
Also Read: 6 Ways to Plot a Circle in Matplotlib
Conclusion
In this article, we covered the Matplotlib draw rectangle. The function matplotlib patches Rectangle is used to create rectangles in a plot. Besides that, we have also looked at its syntax and parameters. For better understanding, we looked at a couple of examples. We varied the syntax and looked at the output for each case.
I hope this article was able to clear all doubts. But if you have any unsolved queries, feel free to write them down below in the comment section.
Done reading this; why not read about ways to convert float to string next?
![[Fixed] typeerror can’t compare datetime.datetime to datetime.date](https://www.pythonpool.com/wp-content/uploads/2024/01/typeerror-cant-compare-datetime.datetime-to-datetime.date_-300x157.webp)
![[Fixed] nameerror: name Unicode is not defined](https://www.pythonpool.com/wp-content/uploads/2024/01/Fixed-nameerror-name-Unicode-is-not-defined-300x157.webp)
![[Solved] runtimeerror: cuda error: invalid device ordinal](https://www.pythonpool.com/wp-content/uploads/2024/01/Solved-runtimeerror-cuda-error-invalid-device-ordinal-300x157.webp)
![[Fixed] typeerror: type numpy.ndarray doesn’t define __round__ method](https://www.pythonpool.com/wp-content/uploads/2024/01/Fixed-typeerror-type-numpy.ndarray-doesnt-define-__round__-method-300x157.webp)
Great article!
I used your code to draw planes and works very good, almost as I needed.
I would like that intersections between vertical planes could be shown as a dashed line or suggested by a difference in colors. Is it posible to do that?
The code I’m using is as follows:
from mpl_toolkits.mplot3d import Axes3D
from mpl_toolkits.mplot3d.art3d import Poly3DCollection
import matplotlib.colors as colors
import matplotlib.pyplot as plt
def plano_xy(x0,y0,x1,y1,z):
return[(x0, y0, z),
(x1, y0, z),
(x1, y1, z),
(x0, y1, z)]
def plano_xz(x0,z0,x1,z1,y):
return[(x0, y, z0),
(x0, y, z1),
(x1, y, z1),
(x1, y, z0)]
def plano_yz(y0,z0,y1,z1,x):
return[(x, y0, z0),
(x, y0, z1),
(x, y1, z1),
(x, y1, z0)]
fig = plt.figure()
ax = Axes3D(fig)
verts=[]
x0=0
y0=0
z0=0
x1=1
y1=1
z1=0.4
verts.append(plano_xy(x0,y0,x1,y1,z0))
verts.append(plano_yz(y0,z0,y1,z1,x0))
verts.append(plano_yz(y0,z0,y1,z1,x1))
verts.append(plano_yz(y0,z0,x1,z1,1*(x0+x1)/3))
verts.append(plano_yz(y0,z0,x1,z1,2*(x0+x1)/3))
ax.add_collection3d(Poly3DCollection(verts, facecolors=’yellow’, linewidths=1, edgecolors=”gray”, alpha=1.0))
verts.append(plano_xz(x0,z0,x1,z1,y0))
verts.append(plano_xz(x0,z0,x1,z1,y1))
verts.append(plano_xz(x0,z0,x1,z1,1*(y0+y1)/3))
verts.append(plano_xz(x0,z0,x1,z1,2*(y0+y1)/3))
ax.add_collection3d(Poly3DCollection(verts, facecolors=’cyan’, linewidths=1, edgecolors=”gray”, alpha=0.5))
ax.set_xlabel(‘X’)
ax.set_ylabel(‘Y’)
ax.set_zlabel(‘Z’)
plt.show()
Hi,
Yes, I checked your code and it’s working perfectly fine. The thing which you mentioned about the intersection is very difficult to draw in Matplotlib.
Of course, you can draw it by using a line but it won’t work like other software like Autocad and most importantly it won’t be dynamic.
So, I suggest you create a function that solves the equation of two planes and calculates its equation. Then if the intersection exists, then draw a line graph by using ax.plot(x, y, z, label=’parametric curve’) where x, y, z are the array of coordinates of your line.
Regards,
Pratik
Great tutorial.
Q: how to draw a rectangle ONLY; not on a scatter, image or other objects?
Yes, you can draw a rectangle by using a dummy point. By default, if you try drawing a rectangle, it’ll not work. So, we’re going to work around it by placing a point in the graph and then drawing a rectangle. The point will be the rectangle’s xy coordinates. Following code will help you –
import matplotlib.pyplot as plt
from matplotlib.patches import Rectangle
fig, ax = plt.subplots()
rect_xy = [1,1]
ax.plot([rect_xy[0]],[rect_xy[1]])
ax.add_patch(Rectangle((rect_xy[0], rect_xy[1]), 2.3, 2.5, fc=’none’, color =’red’, linewidth = 2))
plt.show()
This will draw a rectangle on a clear matplotlib graph.
Regards,
Pratik