
Hello coders!! In this article, we will be learning about Matplotlib pcolormesh in Python. The Matplotlib library in Python is numerical for NumPy library. Pyplot is a library in Matplotlib, which is basically a state-based interface that provides MATLAB-like features. Let us discuss the topic in detail.
Syntax:
matplotlib.pyplot.pcolormesh(*args, alpha=None, norm=None, cmap=None, vmin=None, vmax=None, shading=None, antialiased=False, data=None, **kwargs)Call Signature:
pcolormesh([X, Y,] C, **kwargs)
Parameters:
- C: values that need to be color-mapped are kept in a 2D array.
- X, Y: coordinates of the quadrilateral corners.
- cmap: instance or registered colormap name.
- norm: Normalize instance scales of the data values.
- vmin, vmax: optional parameter, they are color bar range.
- alpha: the intensity of the color.
- snap: snap the mesh to pixel boundaries.
- edgecolors: the color of the edges.
- shading: fill style.
- **kwargs: additional parameters allowed in the function.
Return value of matplotlib pcolormesh:
mesh : matplotlib.collections.QuadMesh
Example of Matplotlob Pcolormesh in Python:
import matplotlib.pyplot as plt
import numpy as np
from matplotlib.colors import LogNorm
Z = np.random.rand(5, 5)
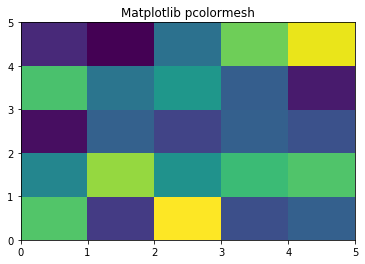
plt.pcolormesh(Z)
plt.title("Matplotlib pcolormesh")
plt.show()
Output:
Explanation:
In this code, we first imported the pyplot library of the matplotlib module of Python to avail its MATLAB-like plotting framework. Next, we imported the NumPy module for array functions. Lastly, the lognorm library of the matplotlib.colors for colormap normalizations.
We used the random.rand() function to create random values in a given shape. We then used the pcolormesh() method to create a pseudocolor plot with a non-regular rectangular grid.
Lastly, we added the title and displayed the graph.
Matplotlib.axes.Axes.pcolormesh() in Python:
Most of the figure elements are contained in the axes class, like:
- Axis
- Tick
- Line2D
- Text
- Polygon
and many more. It sets the coordinate system.
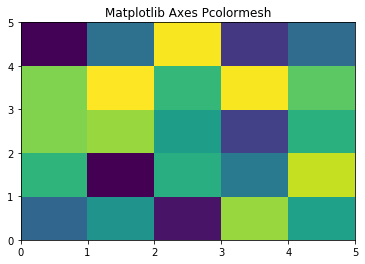
The Axes.pcolormesh() function in the matplotlib axes library is used to create a plot with pseudocolor having a non-regular rectangular grid.
import matplotlib.pyplot as plt
import numpy as np
from matplotlib.colors import LogNorm
Z = np.random.rand(5, 5)
fig, ax = plt.subplots()
ax.pcolormesh(Z)
ax.set_title('Matplotlib Axes Pcolormesh')
plt.show()
Output:
Matplotlib pcolormesh grid and shading:
Let Z have shape (M,N)
So, the grid X and Y can have shape either(M+1,N+1) or (M,N). This depends on the shading keyword.
1) Flat Shading With Matplotlib Pcolormesh:
rows = 5
cols = 5
Z = np.arange(rows * cols).reshape(rows, cols)
x = np.arange(cols + 1)
y = np.arange(rows + 1)
fig, ax = plt.subplots()
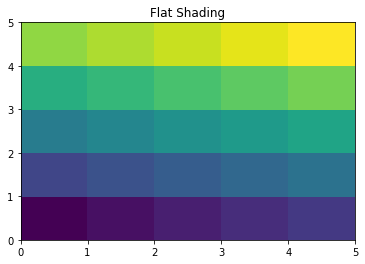
ax.pcolormesh(x, y, Z, shading='flat', vmin=Z.min(), vmax=Z.max())
ax.set_title('Flat Shading'
Output:
Explanation:
Here, we have set the least assumption shading as flat. The grid is also incremented by one in each dimension, i.e., it has a shape (M+1, N+1). In such cases, the value of x and y signify the quadrilateral corners, colored with the value of Z. Here we the edges of the quadrilateral (5,5) are specified as with X and Y that are (6, 6).
2) Gouraud Shading With Matplotlib Pcolormesh:
cols=5
rows=5
fig, ax = plt.subplots(constrained_layout=True)
Z = np.arange(rows * cols).reshape(rows, cols)
x = np.arange(cols)
y = np.arange(rows)
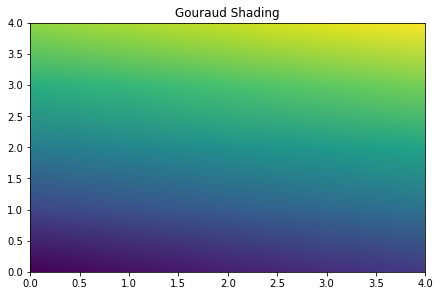
ax.pcolormesh(x, y, Z, shading='gouraud', vmin=Z.min(), vmax=Z.max())
ax.set_title('Gouraud Shading')
plt.show()
Output:
Explanation:
In Gouraud shading, the colors linearly interpolate between the quadrilateral grid points. Also, the shape of X, Y, Z must be the same.
Must Read
- Matplotlib grid With Attributes in Python
- How to create a gif using Python
- Numpy Square Root | Usecase Evaluation of Math Toolkit
- Working With Matplotlib Text in Python
- Matplotlib Arrow() Function With Examples
Conclusion: Matplotlib pcolormesh
With this, we come to an end to the article. We learned about pcolormesh in Matplolib and also saw its various examples. The shading can also be changed as one requires.
However, if you have any doubts or questions, do let me know in the comment section below. I will try to help you as soon as possible.
Happy Pythoning!