
Hello geeks, and welcome to today’s article! We will cover the Matplotlib slider. Along with that, we will also look at its syntax for a better overall understanding. Then we will see the application of all the theory parts through a couple of examples. But before that, let us try to get a general overview of the function.
A slider can mean different things. For instance, a slider created using JavaScript is used for creating an image slider. The slider that we create using the Matplotlib library helps us by controlling the visual properties of our plot. In the next section, we will see how to create a slider.
Creating a slider in Matplotlib
In this section, we will focus on creating a slider. Let us see the code that will help us create our desired slider. A slider is often used to control the visual property of the plot. So, the thing we need to do is create a simple plot.
import numpy as np
from scipy.interpolate import UnivariateSpline
import matplotlib.pyplot as plt

x = np.linspace(0, 10, 20)
y = np.sin(0.5 * x) * np.sin(x * np.random.randn(20))

spline = UnivariateSpline(x, y, s=5)
x_s = np.linspace(0, 10, 100)
y_s = spline(x_s)
fig = plt.figure()

ax = fig.subplots()
p = ax.plot(x, y)
p = ax.plot(x_s, y_s, 'y')

fig = plt.figure()
plt.show()
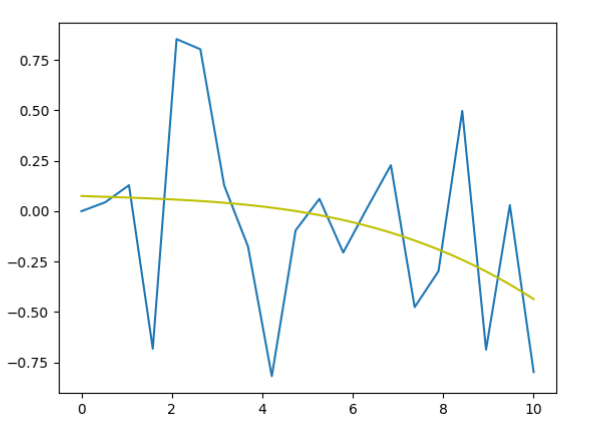
For this article’s purpose, we will be using the sine plot as our reference. For the changing parameter, we will use a spline curve. To get this plot, we have used the help of NumPy, Matplotlib Module, and the spline curve. We need the scipy module. Now the next step is to add a slider to it. Let us see how it is done
import numpy as np
from scipy.interpolate import UnivariateSpline
import matplotlib.pyplot as plt
from matplotlib.widgets import Slider
x = np.linspace(0, 10, 20)
y = np.sin(0.5 * x) * np.sin(x * np.random.randn(20))

spline = UnivariateSpline(x, y, s=5)
x_s = np.linspace(0, 10, 100)
y_s = spline(x_s)
fig = plt.figure()
plt.subplots_adjust(bottom=.25)
ax = fig.subplots()
p = ax.plot(x, y)
p = ax.plot(x_s, y_s, 'y')
ax_slide=plt.axes([.25,.1,.65,.03])
s_factor=Slider(ax_slide,"changing value",valmin=0.2,valmax=1.0,valinit=.6,valstep=.2)


fig = plt.figure()
plt.show()
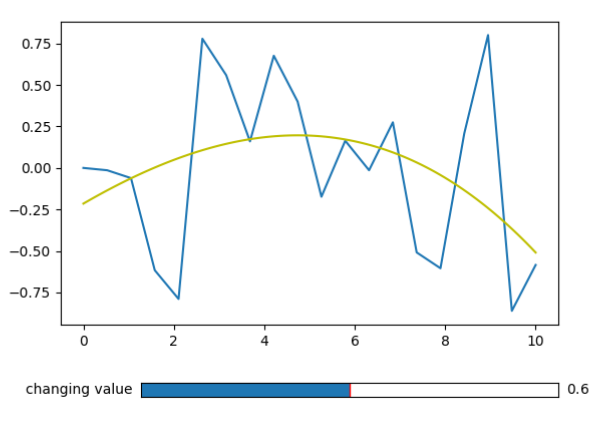
Above, we have successfully added the slider to our plot. To do so, we have made certain additions to our code. First, we have used the subplot adjust function to make the slider space. Then, we have defined the slider dimensions. Next, we have defined the slider parameters such as label, minimum and maximum values. Also, its initial point and valstep. But the fact our slider is not yet connected to the graph, and any change in it will have no change on the plot.
Let us see how to connect them
import matplotlib
matplotlib.use('Qt5Agg')
import numpy as np
from scipy.interpolate import UnivariateSpline
import matplotlib.pyplot as plt
from matplotlib.widgets import Slider


x = np.linspace(0, 10, 20)
y = np.sin(0.5 * x) * np.sin(x * np.random.randn(20))

spline = UnivariateSpline(x, y, s=5)
x_spline = np.linspace(0, 10, 100)
y_spline = spline(x_spline)

fig = plt.figure()
plt.subplots_adjust(bottom=0.25)
ax = fig.subplots()
p = ax.plot(x, y)
p, = ax.plot(x_spline, y_spline, 'y')

ax_slide = plt.axes([0.25, 0.1, 0.65, 0.03])

s_factor = Slider(ax_slide, 'changing factor',
                  1, 5, valinit=2.5, valstep=0.5)


def update(val):
    current_v = s_factor.val
    spline = UnivariateSpline(x, y, s=current_v)
    p.set_ydata(spline(x_spline))
    fig.canvas.draw()

s_factor.on_changed(update)
plt.show()
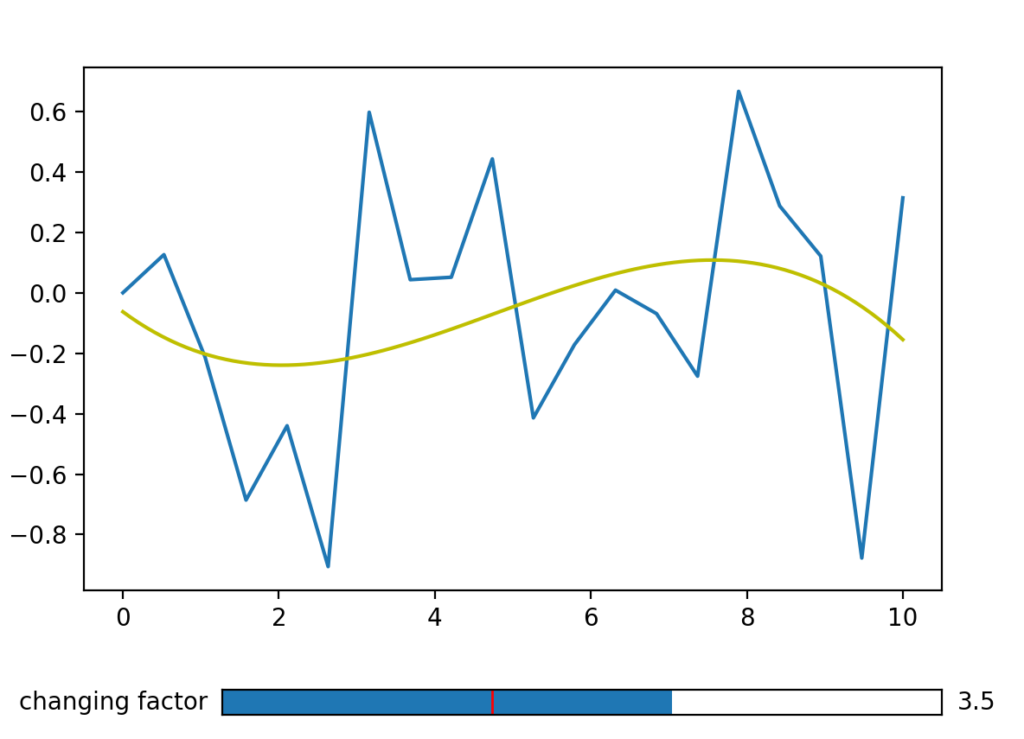
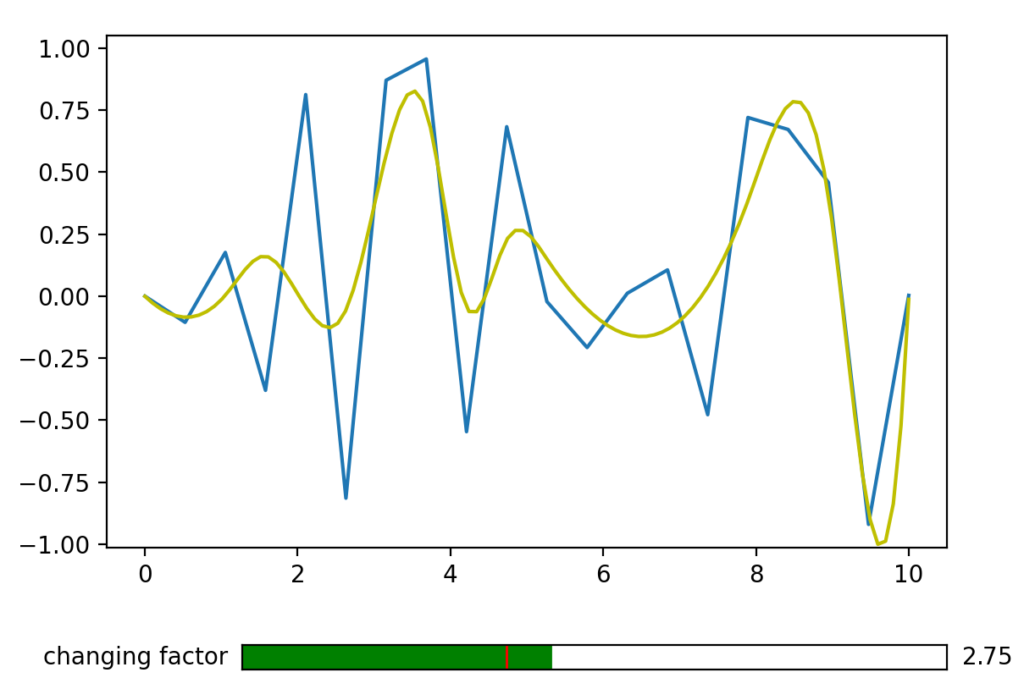
Here we are able to successfully connect the slider to the graph. Also now if make any change in slider it will cause a change in the plot. In order to do so, we have defined a function as it is quite evident from the code.
Change the color of Matplotlib slider
If you wish you can change the colour of your slider. In order to do so, all you need to do is add a colour parameter when defining the slider parameter. From the above code, all we need to do is add the following thing
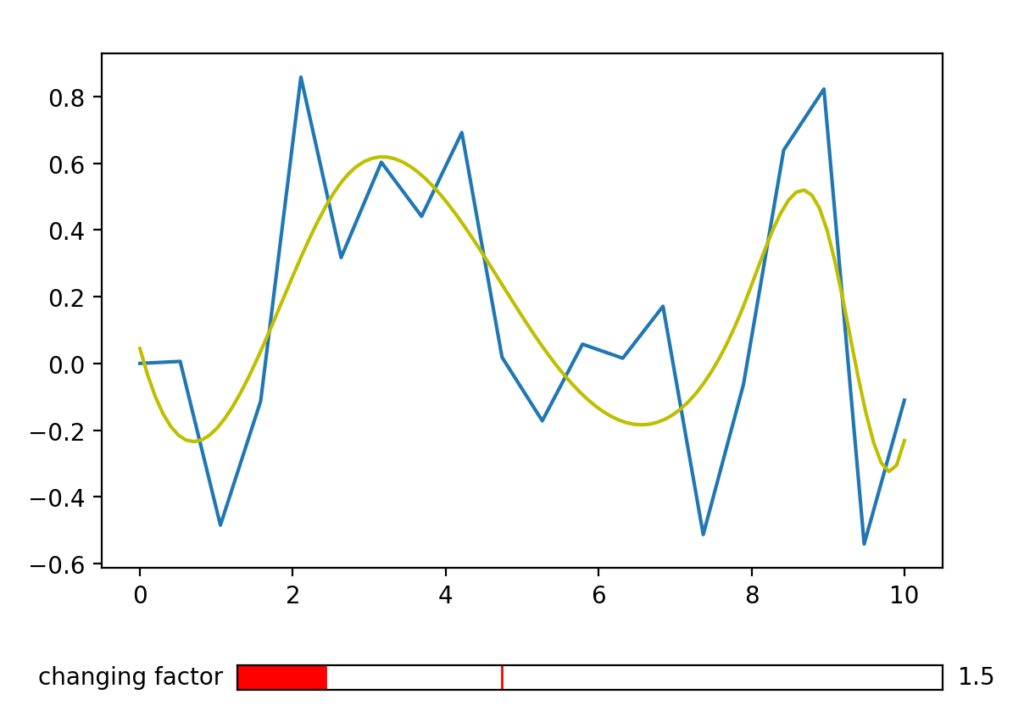
s_factor = Slider(ax_slide, 'changing factor',
                  1, 5, valinit=2.5, valstep=0.5,color="red")
See how we can change our slider’s color similarly if you wish to change the step at which the slider increases or decreases. You can also do so by making a change in the “valstep” parameter. You can see the code below
s_factor = Slider(ax_slide, 'changing factor',
                  1, 5, valinit=2.5, valstep=0.25,color="green")
How to zoom on the plot using the slider
With the help of a slider in matplotlib, we can also zoom in and out of the plot. The code through which we can achieve it is given below
import matplotlib
matplotlib.use('Qt5Agg')
from numpy import pi, sin
import numpy as np
import matplotlib.pyplot as plt
from matplotlib.widgets import Slider, Button, RadioButtons
def signal(amp, freq):
    return amp * sin(2 * pi * freq * t)
axis_color = 'lightgoldenrodyellow'
fig = plt.figure()
ax = fig.add_subplot(111)
fig.subplots_adjust(left=0.25, bottom=0.25)
t = np.arange(-10, 10.0, 0.001)
[line] = ax.plot(t, signal(5, 2), linewidth=2, color='red')
ax.set_xlim([0, 1])
ax.set_ylim([-10, 10])
zoom_slider_ax = fig.add_axes([0.25, 0.1, 0.65, 0.03], facecolor=axis_color)
zoom_slider = Slider(zoom_slider_ax, 'Zoom', -1, 1, valinit=0)
def sliders_on_changed(val, scale_factor=0.25):
    cur_xlim = ax.get_xlim()
    cur_ylim = ax.get_ylim()
    scale = zoom_slider.val*scale_factor
    x_left = 0 + scale
    x_right = 1 - scale
    y_top = 10 - scale*10
    y_bottom = -10 + scale*10
    ax.set_xlim([x_left, x_right])
    ax.set_ylim([y_bottom, y_top])
    fig.canvas.draw_idle()
zoom_slider.on_changed(sliders_on_changed)
reset_button_ax = fig.add_axes([0.8, 0.025, 0.1, 0.04])
reset_button = Button(reset_button_ax, 'Reset', color=axis_color, hovercolor='0.975')
def reset_button_on_clicked(mouse_event):
    zoom_slider.reset()
reset_button.on_clicked(reset_button_on_clicked)
color_radios_ax = fig.add_axes([0.025, 0.5, 0.15, 0.15], facecolor=axis_color)
color_radios = RadioButtons(color_radios_ax, ('red', 'blue', 'green'), active=0)
def color_radios_on_clicked(label):
    line.set_color(label)
    fig.canvas.draw_idle()
color_radios.on_clicked(color_radios_on_clicked)
plt.show()
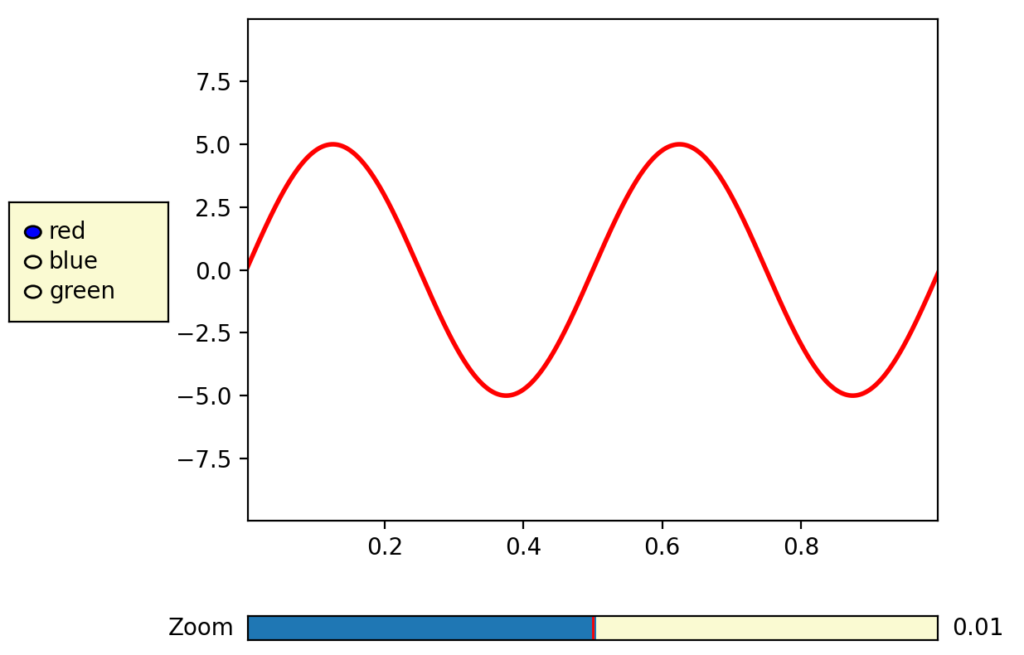
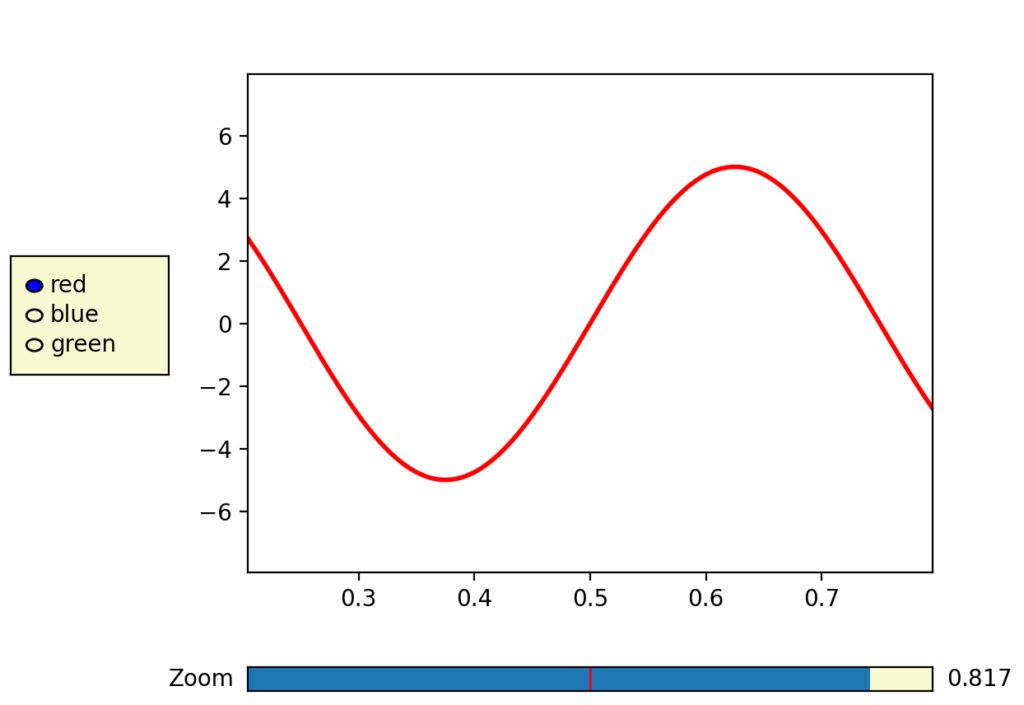
This is the original graph that we get as output. Now using the slider we change the overall representation of the plot. Image below shows the change that happens
Matplotlib Slider Not Working Problem Fixed
Matplotlib widget requires external support to display them in the window. More importantly, they can remain uninitialized if used in Pycharm or Jupyter’s customized Python shell. As this software doesn’t support certain GUI modules, you need to change the base module used for GUI creation.
Suppose you are using Pycharm Ide or Jupyter Notebook to write your program. Then, widgets may not be interactive in nature. To make them interactive, all you need to do is install the “PYQT5” module and add this to your code –
import matplotlib
matplotlib.use('Qt5Agg')
This way, our widget becomes interactive. Qt5Agg refers to the PyQT5 module, which is famous for its advanced-level GUI functions. Before using this module, you need to make sure you have PyQT5 installed on your computer. If not, then run this command in your terminal – pip install PyQt5
Using this function will make sure that your Matplotlib windows are created using the PyQT5 module.
Alternative Solution –
import matplotlib.pyplot as plt
from matplotlib.widgets import Slider, Button, RadioButtons
import matplotlib

matplotlib.use('TkAgg')
Moreover, if using PyQT5 as a GUI interface doesn’t work for you, you need to change the module to a basic Tkinter. As Tkinter is pre-installed in Python and doesn’t require external modules, it can run easily.
Conclusion
In this article, we covered the Matplotlib Slider. We looked at a step-by-step procedure on how we can execute this in our program. We also looked at the trick, making our slider interactive. In the end, we can conclude that through the slider, we can change the visual representation of our plot.
I hope this article was able to clear all doubts. But in case you have any unsolved queries feel free to write them below in the comment section.