Hello Programmers, in this article, we will discuss Matplotlib text in Python. Matplotlib extensively supports including and formatting texts in Python programs. It also supports mathematical expressions, TrueType support for raster and vector outputs, newline-separated text with arbitrary rotations, and Unicode support. The user has a great deal of control over text properties (font size, font weight, text location, color, etc.) with sensible defaults already set.
Matplotlib Text is a tool that allows you to add texts to your matplotlib graphs. With the ability to control the text’s x and y coordinates, you can easily add it to any frame. In this post, we’ll look at the syntax and usage of matplotlib.pyplot.text.
Syntax of Matplotlib text
matplotlib.pyplot.text(x, y, s, fontdict=None, withdash=<deprecated parameter>, **kwargs)Parameters:
x, y: scalars The position to place the text. By default, this is in data coordinates.
s: str The text to be inserted.
fontdict: dictionary, default: None A dictionary to override the default text properties. If fontdict is None, the defaults are determined by your rc parameters. (Optional)
withdash: boolean, default: False Creates a Textwithdash instance instead of a Text instance. (Optional) **kwargs: Controls Text properties
Returns:
text : str
The created text instance.
Basic Matplotlib Text commands
pyplot API | OO API | description |
|---|---|---|
text | text | Add text at an arbitrary location of the Axes. |
annotate | annotate | Add an annotation with an optional arrow at an arbitrary location of the Axes. |
xlabel | set_xlabel | Add a label to the Axes‘s x-axis. |
ylabel | set_ylabel | Add a label to the Axes’s y-axis. |
title | set_title | Add a title to the Axes. |
figtext | text | Add text at an arbitrary location of the Figure. |
suptitle | suptitle | Add a title to the Figure. |
Example of Matplotlib Text in Python
import numpy as np
import matplotlib.pyplot as plt
x = np.arange(0,4,0.2)
y = np.exp(x)
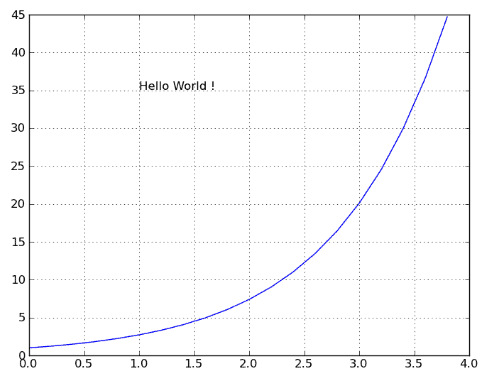
plt.text(1,35,'Hello World !')
plt.grid()
plt.plot(x,y)
plt.show()
Output:
Explanation:
To add some text on a matplotlib figure, matplotlib.pyplot.text() function is used. It is mandatory to provide the position of the text (x,y) and the text itself. In the above example, the text ‘Hello World !’ is placed at the coordinates (1,35).
Changing the style of Matplotlib Text in Python
import numpy as np
import matplotlib.pyplot as plt

f = plt.figure()
ax = f.add_subplot(111)

x = np.arange(0,4,0.2)
y = np.exp(x)

plt.text(0.5,0.5,'Hello World !',horizontalalignment='center',
     verticalalignment='center', transform = ax.transAxes, fontsize=14, color='r')

plt.grid()
plt.plot(x,y)

plt.show()
Output:
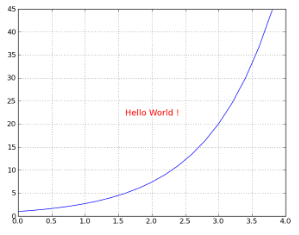
Explanation:
The text added to a matplotlib figure at a particular x and y coordinate can be modified to various properties. In the above example, the x and y coordinates and the text are given as parameters to the matplotlib.pyplot.text() function. Also, the desired attributes for the text, like horizontalalignment=’center’,
verticalalignment=’center’, transform = ax.transAxes, fontsize=14, color=’r’ are passed as **kwargs argument to the matplotlib text function.
Labels for the x and y axis
import matplotlib.pyplot as plt
import numpy as np
x1 = np.linspace(0.0, 5.0, 100)
y1 = np.cos(2 * np.pi * x1) * np.exp(-x1)
fig, ax = plt.subplots(figsize=(5, 3))
fig.subplots_adjust(bottom=0.15, left=0.2)
ax.plot(x1, y1)
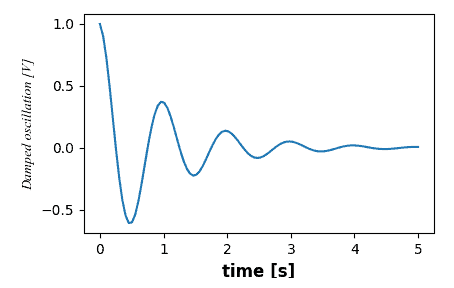
ax.set_xlabel('time [s]')
ax.set_ylabel('Damped oscillation [V]')
plt.show()
Output:
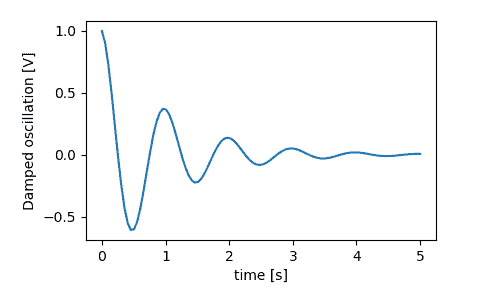
Explanation:
We can set labels for the x-axis and y-axis simply by specifying them in the set_xlabel() and set_ylabel() methods, respectively. Setting labels for the axes is a way of implementing the text in the matplotlib figures plotted. In the above example, the label of the x-axis is set as ‘time [s],’ bypassing the text as an argument to the set_xlabel() method. Similarly, the y-axis is set to ‘Damped oscillation [V],’ bypassing it directly to the set_ylabel method.
Also Read: Matplotlib Quiver Plot
Matplotlib Text Font Poperties for Labels
from matplotlib.font_manager import FontProperties

font = FontProperties()
font.set_family('serif')
font.set_name('Times New Roman')
font.set_style('italic')

fig, ax = plt.subplots(figsize=(5, 3))
fig.subplots_adjust(bottom=0.15, left=0.2)
ax.plot(x1, y1)
ax.set_xlabel('time [s]', fontsize='large', fontweight='bold')
ax.set_ylabel('Damped oscillation [V]', fontproperties=font)

plt.show()
Output:
Explanation:
Text inserted as labels for the matplotlib figures can be changed by manipulating the matplotlib.font_manager.FontProperties method. Properties of the labels can also be modified by named kwargs to set_xlabel and set_ylabel methods. In the above example, the label for the y-axis is changed by using the method. Whereas, the label for the x-axis is changed by passing the fontsize=’large’ and fontweight=’bold’ as **kwargs argument to the set_xlabel method.
Titles in Matplotlib text in Python
fig, axs = plt.subplots(figsize=(5, 6))
locs = 'centre'
for ax, loc in zip(axs, locs):
    ax.plot(x1, y1)
    ax.set_title('Title with loc at '+loc, loc=loc)
plt.show()
Output:
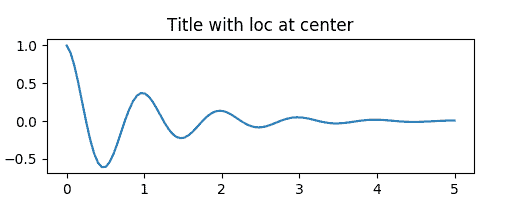
Explanation:
Matplotlib text in Python can also be added as titles over the figures. Titles are set in much the same way as labels, but there are the loc keyword arguments that can change the position and justify the default value of loc=center. In the above example, the default value of loc itself is used, inserted the text as a title at the figure’s center.
Adding Annotations to Arrows using Matplotlib text
import matplotlib.pyplot as plt

#define two arrays for plotting
A = [3, 5, 5, 6, 7, 8]
B = [12, 14, 17, 20, 22, 27]

#add arrow to plot
plt.arrow(x=4, y=18, dx=0, dy=5, width=.08)

#add annotation
plt.annotate('General direction', xy = (3.3, 17))

#display plot
plt.show()
Output:
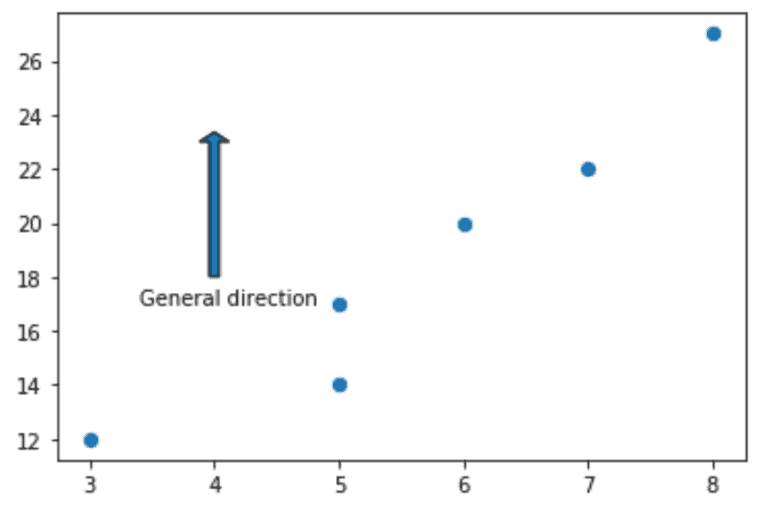
Explanation:
Adding annotations to an arrow, means adding text around the arrow at a specific value of x and y coordinate.
Syntax of Annotate function:
matplotlib.pyplot.annotate(text, xy,*args,**kwargs)
Where text to be added x and y are the point to annotate and, *args and **kwargs are optional parameters that control annotation properties. In the above example, the ‘General direction’ text is added at x = 3.3 and y = 17.
Conclusion
This article presents the Matplotlib text function in Python with examples. Also, different ways/ forms of implementing Matplotlib text in Matplotlib figures are discussed. Some ways include inserting text as labels, titles, and annotations. Refer to this article for more details regarding Matplotlib text in Python.
However, if you have any doubts or questions, do let me know in the comment section below. I will try to help you as soon as possible.
Happy Pythoning!