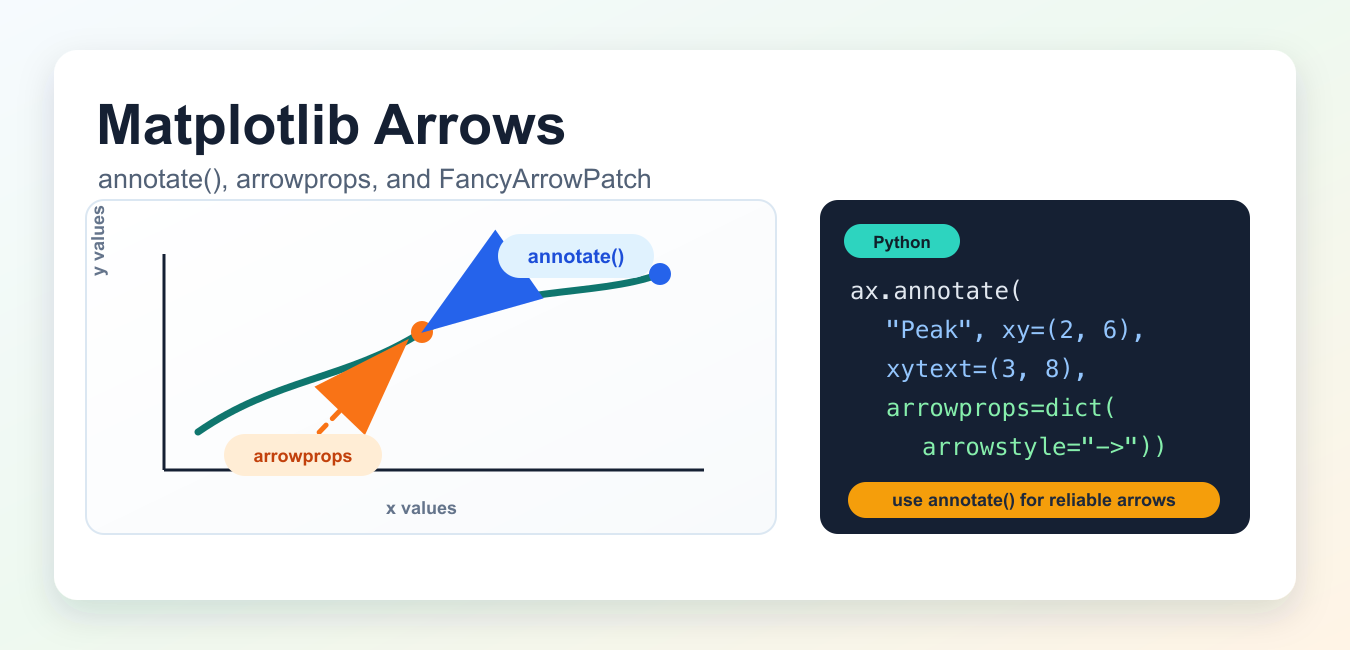
Quick answer: Matplotlib arrows are usually easiest to draw with annotate, where xy is the arrow target and xytext is the start. Choose the coordinate system deliberately, style the arrowhead with arrowprops, and leave enough plot margin for labels and saved output.
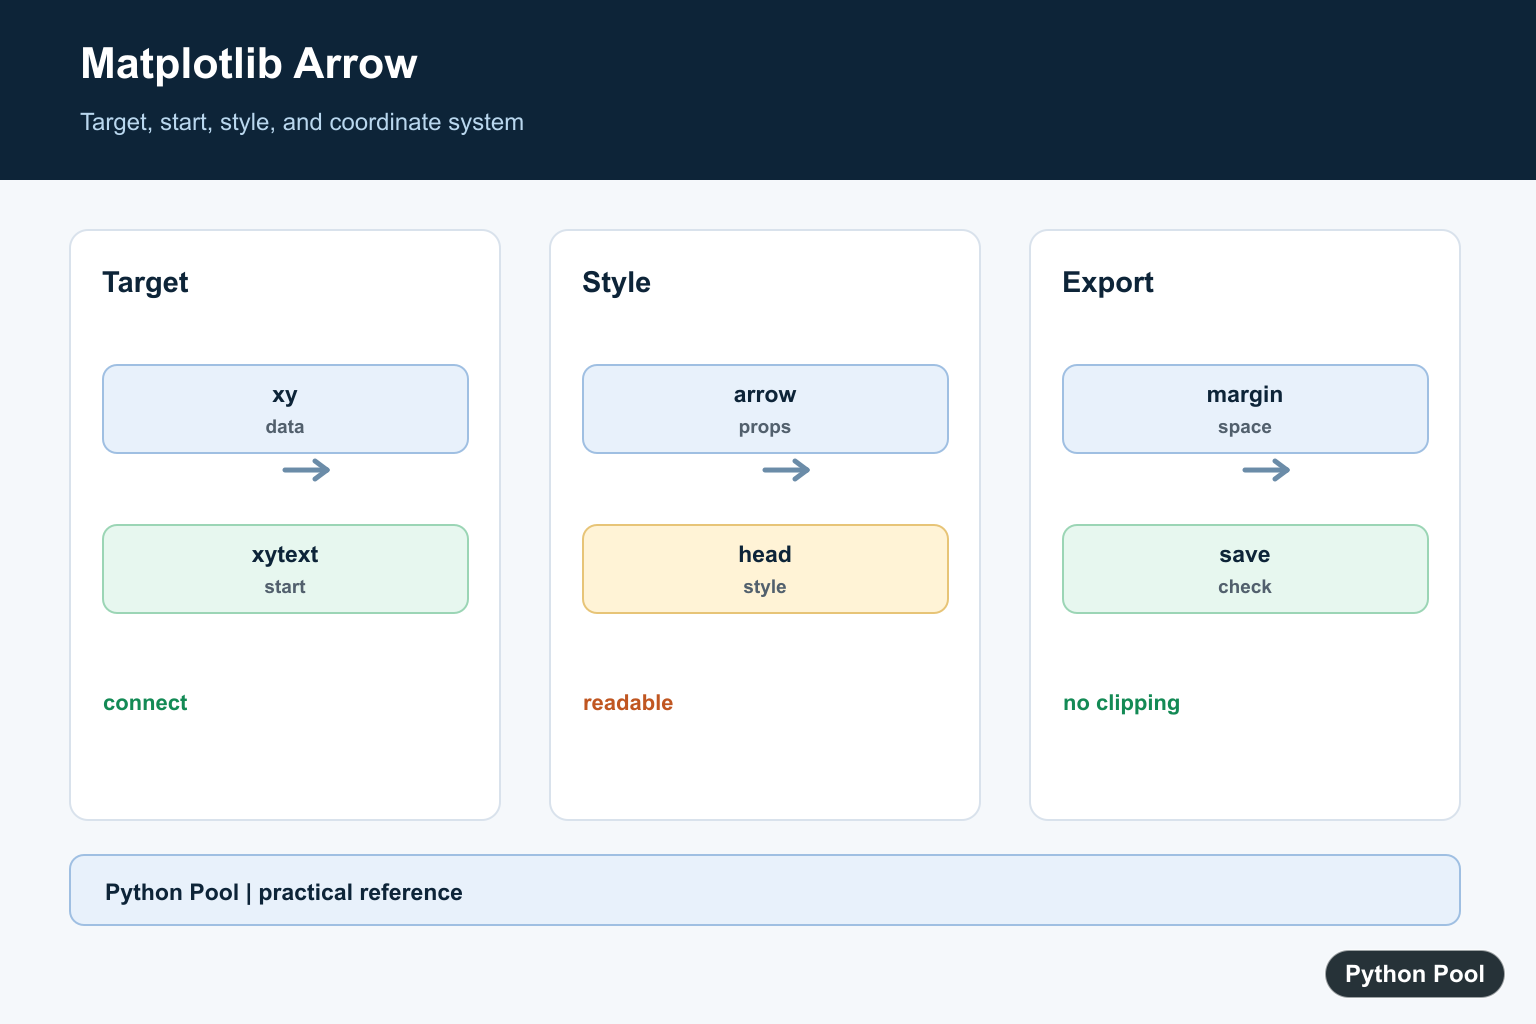
Matplotlib arrows are useful for pointing to peaks, showing direction, connecting two points, or marking a change on a plot. The important update is that matplotlib.pyplot.arrow() still exists, but the Matplotlib documentation discourages it for many plots because axis limits and aspect ratio can distort the arrow. For most chart annotations, use annotate() with arrowprops.
Which Matplotlib arrow API should you use?
- Use
ax.annotate()when you want an arrow with a label. - Use
ax.annotate("", ...)when you want only an arrow and no text. - Use
FancyArrowPatchwhen you need a patch object with more control over style, connection, or reuse. - Use
plt.arrow()only for simple cases where you understand the aspect-ratio limitation.
Draw an arrow with annotate()
The most common pattern is to point from label text to a data point. The xy argument is the point being annotated, and xytext is where the label should appear.
import matplotlib.pyplot as plt

x = [1, 2, 3]
y = [2, 6, 4]

fig, ax = plt.subplots()
ax.plot(x, y, marker="o")

ax.annotate(
    "Peak",
    xy=(2, 6),
    xytext=(2.35, 7.2),
    arrowprops=dict(arrowstyle="->", linewidth=2, color="tab:blue"),
)

plt.show()
This approach is usually better than plt.arrow() because the arrow is drawn through the annotation system and supports text placement, coordinate choices, clipping behavior, and patch styling.
Use data and offset coordinates correctly
By default, xy and xytext use data coordinates. That means xy=(2, 6) points to the data location where x is 2 and y is 6. This is usually what you want when labeling a point on a line chart, scatter plot, or bar chart.
For labels that should sit a fixed distance away from the point, use offset coordinates. The example below places the text 25 points above and 15 points to the right of the selected point, while the arrow still points to the data location.
ax.annotate(
    "Peak",
    xy=(2, 6),
    xytext=(15, 25),
    textcoords="offset points",
    arrowprops=dict(arrowstyle="->"),
)
This is often easier to maintain than hard-coding another data coordinate for the label position, especially when the data scale changes.
Draw an arrow without text
If you only need an arrow, pass an empty string as the annotation text. This is the Matplotlib documentation’s recommended replacement pattern for many pyplot.arrow() examples.
fig, ax = plt.subplots()

ax.annotate(
    "",
    xy=(0.8, 0.8),
    xytext=(0.2, 0.2),
    arrowprops=dict(arrowstyle="->", linewidth=2),
)

ax.set_xlim(0, 1)
ax.set_ylim(0, 1)
plt.show()
Style arrows with arrowprops
The arrowprops dictionary controls the arrow that connects xytext to xy. Common options include arrowstyle, color, linewidth, mutation_scale, and connectionstyle.
ax.annotate(
    "Change",
    xy=(4, 10),
    xytext=(2.8, 12),
    arrowprops=dict(
        arrowstyle="-|>",
        color="tab:green",
        linewidth=2,
        mutation_scale=18,
        connectionstyle="arc3,rad=0.2",
    ),
)
Use arrowstyle="->" for a simple arrow, "<-" to reverse the head, "<->" for two heads, and "-|>" for a filled head. Curved arrows are controlled through connectionstyle.
Use FancyArrowPatch for custom arrows
FancyArrowPatch is the lower-level patch class behind many annotation arrows. It is useful when you want to create an arrow object directly and add it to an axes.
from matplotlib.patches import FancyArrowPatch

fig, ax = plt.subplots()

arrow = FancyArrowPatch(
    (0.15, 0.25),
    (0.85, 0.75),
    arrowstyle="-|>",
    mutation_scale=24,
    linewidth=2,
    color="tab:green",
)

ax.add_patch(arrow)
ax.set_xlim(0, 1)
ax.set_ylim(0, 1)
plt.show()
For most everyday plots, start with annotate(). Move to FancyArrowPatch when you need patch-level control.
What about plt.arrow()?
The basic syntax is still:
plt.arrow(x, y, dx, dy, width=0.01)
Here, x and y are the arrow base, while dx and dy are the change in x and y direction. The problem is that the arrow shape can look wrong after aspect-ratio changes, zooming, or axis-limit changes. That is why current Matplotlib guidance points users toward annotate() for reliable arrows.
Common mistakes
- Using
plt.arrow()for publication plots without checking the final aspect ratio. - Confusing
xyandxytext. The arrow points from the text position towardxy. - Forgetting to set axis limits when an arrow patch is added outside the current data range.
- Using
colorandedgecolorinconsistently on patch-based arrows. - Adding arrows before deciding the final Matplotlib aspect ratio.
Related Matplotlib guides
For more plot annotation work, read our guides on Matplotlib annotate(), Matplotlib zorder, Matplotlib vertical lines, Matplotlib tight_layout(), and Matplotlib gca().
Official references
- Matplotlib documentation for pyplot.arrow
- Matplotlib documentation for pyplot.annotate
- Matplotlib documentation for FancyArrowPatch
Draw A Data-Space Arrow
annotate connects two data coordinates and keeps the arrow attached to the plotted values as the axes scale changes. Use a clear arrow style and color.
import matplotlib.pyplot as plt

fig, ax = plt.subplots()
ax.plot([0, 1, 2], [1, 2, 3])
ax.annotate("increase", xy=(2, 3), xytext=(1, 1.5), arrowprops={"arrowstyle": "-|>"})
print(ax.get_xlim(), ax.get_ylim())
Control The Coordinate System
Data coordinates are not the same as axes-fraction or figure coordinates. If an annotation should stay in a corner, use an appropriate transform rather than guessing data values.
import matplotlib.pyplot as plt

fig, ax = plt.subplots()
ax.plot([0, 1], [0, 1])
ax.annotate("corner", xy=(0.95, 0.95), xycoords="axes fraction", xytext=(0.7, 0.7), textcoords="axes fraction", arrowprops={"arrowstyle": "->"})
print("annotation added")
Style The Arrowhead
arrowprops can set style, color, line width, connection style, and shrink. Keep the head large enough to see but subordinate to the data.
import matplotlib.pyplot as plt

fig, ax = plt.subplots()
ax.annotate("target", xy=(4, 4), xytext=(1, 1), arrowprops={"arrowstyle": "-|>", "color": "darkgreen", "linewidth": 2})
print("styled arrow")
Check The Exported Figure
An interactive window can hide clipping that appears in a file. Add margins, choose a suitable z-order, and render the actual output format before publishing it.
import matplotlib.pyplot as plt

fig, ax = plt.subplots(figsize=(5, 3))
ax.annotate("edge", xy=(1, 1), xytext=(0.2, 0.2), arrowprops={"arrowstyle": "->"})
fig.savefig("arrow-example.png", bbox_inches="tight")
print("saved")
Arrows should answer a visual question rather than decorate an otherwise ambiguous plot. Decide whether the arrow marks a data trend, points to a feature, or indicates a process step. For dense charts, use a legend or short label so several arrows do not overlap. Check the arrow after changing the axis limits, aspect ratio, figure size, or backend because those changes can affect readability. Matplotlib’s Axes.annotate() reference documents arrow properties and coordinate systems. Related references include axis limits, figure export, and text annotations.
For related chart controls, compare axis limits, figure export, and text annotations when placing an arrow.
Frequently Asked Questions
How do I draw an arrow in Matplotlib?
Use annotate with an xy target and xytext start, or an arrow patch when you need lower-level control.
How do I add an arrowhead?
Pass arrowprops to annotate and choose an arrow style such as -|> along with color and width.
Why is my arrow in the wrong place?
Check whether the coordinates are data, axes-fraction, figure, or display coordinates and set the transform deliberately.
How do I keep an arrow visible in a saved figure?
Leave enough margin for the head and label, use a suitable z-order, and verify the rendered output rather than only the interactive view.