
Hello programmers, in today’s article, we will discuss Matplotlib Boxplot in Python.A Box Plot is a Whisker plot in simpler terms. Box plots are created to summarize data values having properties like minimum, first quartile, median, third quartile, and maximum. In the box plot, a box is created from the first quartile to the third quartile.
A verticle line is also there, which goes through the box at the median. Here x-axis denotes the data, and the y-axis shows the frequency distribution. The Pyplot module of the Matplotlib library provides MATLAB like features. Hence, the matplotlib.pyplot.boxplot() function is used to create box plots. Before we cite examples of Matplotlib Boxplot, let me brief you with the syntax and parameters of the same.
Syntax of Matplotlib Boxplot in Python
matplotlib.pyplot.boxplot(data, notch=None, vert=None, patch_artist=None, widths=None)
Parameters: Matplotlib Boxplot
- data: Sequence or array to be plotted
- notch: Accepts boolean values (Optional)
- vert: Accepts boolean values false and true for horizontal and vertical plot respectively (Optional)
- bootstrap: Accepts int specific intervals around notched boxplots.
- usermedians: Array or sequence of dimensions compatible with data
- positions: Array and sets the position of boxes (Optional)
- widths: Array and sets the width of boxes (Optional)
- patch_artist: Boolean values. If
False, produces boxes with the Line2D artist. Otherwise, boxes and drawn with Patch artists (Optional) - labels: Array of strings sets label for each datase (Optional)
- meanline: If true, tries to render meanline as full width of box
- zorder: Sets the zorder of the boxplot (Optional)
Return Type: Matplotlib Boxplot
The Matplotlib boxplot function returns a dictionary mapping each component of the boxplot to a list of the Line2D instances created. That dictionary has the following keys (assuming vertical boxplots):
boxes: the main body of the boxplot showing the quartiles and the median’s confidence intervals if enabled.medians: horizontal lines at the median of each box.whiskers: the vertical lines extending to the most end, non-outlier data points.caps: the horizontal lines at the ends of the whiskers.fliers: points representing data that extend beyond the whiskers (fliers).means: points or lines representing the means.
Example of Matplotlib Boxplot in Python
import matplotlib.pyplot as plt
import numpy as np


# Creating dataset
np.random.seed(10)
data = np.random.normal(100, 20, 200)

fig = plt.figure(figsize =(10, 7))

# Creating plot
plt.boxplot(data)

# show plot
plt.show()
OUTPUT:

EXPLANATION:
Firstly, the data values are given to the ax.boxplot() method can be a Numpy array or Python list, or a Tuple of arrays. In the above example, we create the box plot using numpy.random.normal() to create some random data. In addition, it takes the mean, standard deviation, and the desired number of values as arguments.
Multiple Dataset Boxplot
import matplotlib.pyplot as plt
import numpy as np


# Creating dataset
np.random.seed(10)

data_1 = np.random.normal(100, 10, 200)
data_2 = np.random.normal(90, 20, 200)
data_3 = np.random.normal(80, 30, 200)
data_4 = np.random.normal(70, 40, 200)
data = [data_1, data_2, data_3, data_4]

fig = plt.figure(figsize =(10, 7))

# Creating axes instance
ax = fig.add_axes([0, 0, 1, 1])

# Creating plot
bp = ax.boxplot(data)

# show plot
plt.show()
OUTPUT:
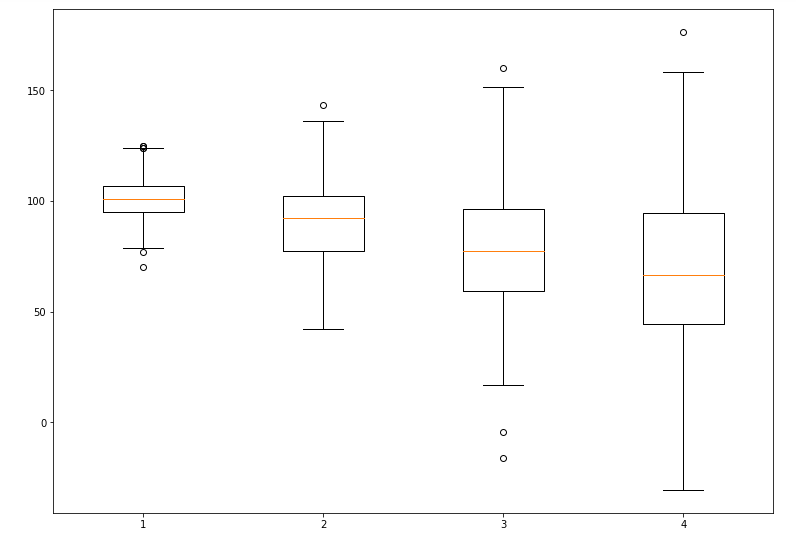
EXPLANATION:
Firstly, in the above example, multiple data set plots multiple box plots under the same axes. The four data sets are Numpy arrays using numpy.random.normal() function. These four data sets are then passed as data values to the data array. Moreover, these data array as an argument to the matplotlib boxplot() function is used, multiple boxplots are created.
Customized Matplotlib Boxplot
<pre class="wp-block-syntaxhighlighter-code">import matplotlib.pyplot as plt
import numpy as np

# Creating dataset
np.random.seed(10)
data_1 = np.random.normal(100, 10, 200)
data_2 = np.random.normal(90, 20, 200)
data_3 = np.random.normal(80, 30, 200)
data_4 = np.random.normal(70, 40, 200)
data = [data_1, data_2, data_3, data_4]

fig = plt.figure(figsize =(10, 7))
ax = fig.add_subplot(111)

# Creating axes instance
bp = ax.boxplot(data, patch_artist = True,
                notch ='True', vert = 0)

colors = ['#0000FF', '#00FF00',
          '#FFFF00', '#FF00FF']

for patch, color in zip(bp['boxes'], colors):
    patch.set_facecolor(color)

# changing color and linewidth of
# whiskers
for whisker in bp['whiskers']:
    whisker.set(color ='#8B008B',
                linewidth = 1.5,
                <a href="http://www.pythonpool.com/matplotlib-linestyle/" target="_blank" rel="noreferrer noopener">linestyle</a> =":")

# changing color and linewidth of
# caps
for cap in bp['caps']:
    cap.set(color ='#8B008B',
            linewidth = 2)

# changing color and linewidth of
# medians
for median in bp['medians']:
    median.set(color ='red',
               linewidth = 3)

# changing style of fliers
for flier in bp['fliers']:
    flier.set(marker ='D',
              color ='#e7298a',
              alpha = 0.5)

# x-axis labels
ax.set_yticklabels(['data_1', 'data_2',
                    'data_3', 'data_4'])

# Adding title
plt.title("Customized box plot")

# Removing top axes and right axes
# ticks
ax.get_xaxis().tick_bottom()
ax.get_yaxis().tick_left()

# show plot
plt.show(bp) </pre>
OUTPUT:

EXPLANATION:
Firstly, the matplotlib.pyplot.boxplot() provides many customization possibilities to the box plot. The notch = True creates the notch format to the box plot. We can set different colors to different boxes. The patch_artist = True fills the boxplot with colors. In addition, the vert = 0 attribute creates a horizontal box plot. Labels take the same dimensions as the number of data sets.
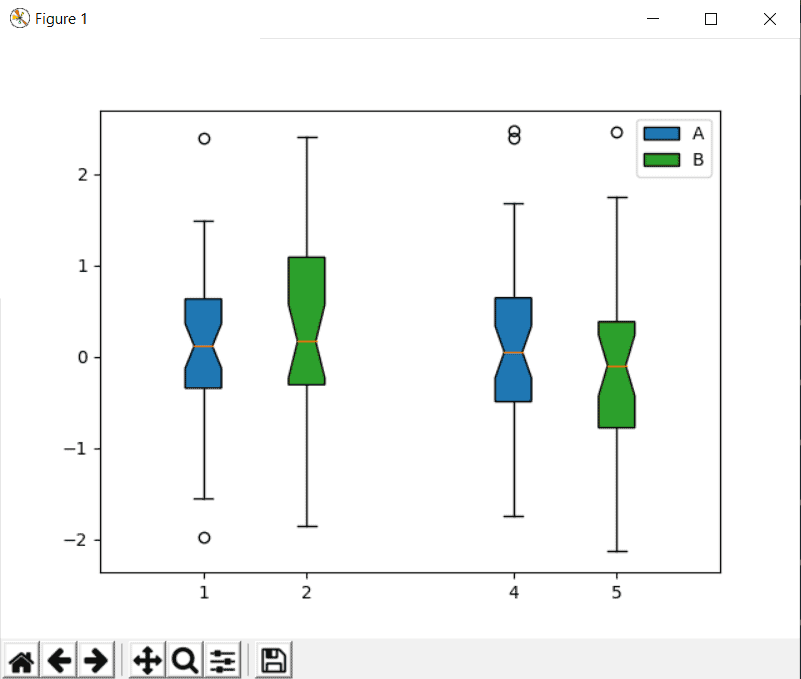
Boxplot With Legend
Legend is very useful in describing the elements of the plots. By using matplotlib.pyplot.legend() you can add custom legends in your code which can demonstrate the details of the graph. Following is an example of it –
import matplotlib.pyplot as plt
import numpy as np

np.random.seed(10)
data1=np.random.randn(40,2)
data2=np.random.randn(30,2)

fig, ax = plt.subplots()
bp1 = ax.boxplot(data1, positions=[1,4], notch=True, widths=0.35, patch_artist=True, boxprops=dict(facecolor="C0"))
bp2 = ax.boxplot(data2, positions=[2,5], notch=True, widths=0.35, patch_artist=True, boxprops=dict(facecolor="C2"))

ax.legend([bp1["boxes"][0], bp2["boxes"][0]], ['A', 'B'], loc='upper right')

ax.set_xlim(0,6)
plt.show()
Output –
Must Read
- How to use Python Truncate to Resize Files
- Python vars() Function Explained With Examples
- Matplotlib Arrow() Function With Examples
Conclusion
In this article, we have learned about various ways of using the Matplotlib Boxplot in Python. We can implement multiple boxplots under the same axes by defining as many data sets as desired. Also, the Matlotlib boxplot provides endless ways of customizing the boxplots. Different customization attributes have also been discussed. Refer to this article in case of any queries regarding the Matplotlib boxplot() function.
However, if you have any doubts or questions, do let me know in the comment section below. I will try to help you as soon as possible.
Happy Pythoning!
Informative on making boxplots, is there any way to add a legend indicating the mean and median
Hi, thank you for your comment.
I’ve added a section describing how you can add a legend in your boxplots. Try the same for mean and median.
Please let us know if you have any other doubt. We’ll try our best to resolve them.