Hello programmers, today’s article is all about the Matplotlib Contourf () function in Python.
The contourf () function in the pyplot module of the matplotlib library helps plot contours. Level plots are also termed Contour Plots. They are tools for doing multivariate analysis and visualizing 3-D plots in 2-D space.
We will look into examples and implementations of the Matplotlib contourf() function. But before that, let me just brief you about the syntax and parameters of the contourf() function.
Syntax of contourf() function:
matplotlib.pyplot.contourf(*args, data=None, **kwargs)
Call Signature: contour([X, Y,] Z, [levels], **kwargs)
Parameters of Matplotlib Contourf:
- X, Y: Both the parameters should have the same shape as Z. They must both be 1-D such that len(X) is the number of columns in Z and len(Y) is the number of rows in Z.
- Z: Height values over which the contour is drawn. (Array-like)
- levels: Determine the numbers and positions of the contour lines/regions. For integer n, use n data intervals, i.e., draw n+1 contour lines. For arrays, draw contour lines at the specified levels. The values must be in increasing order.
Return type:
Returns a contour plot based on the desired parameters passed as arguments to the contourf() function.
Example of Matplotlib contourf()
import matplotlib.pyplot as plt
import numpy as np

feature_x = np.linspace(-5.0, 3.0, 70)
feature_y = np.linspace(-5.0, 3.0, 70)

# Creating 2-D grid of features
[X, Y] = np.meshgrid(feature_x, feature_y)

fig, ax = plt.subplots(1, 1)

Z = X ** 2 + Y ** 2

# plots filled contour plot
ax.contourf(X, Y, Z)

ax.set_title('Filled Contour Plot')
ax.set_xlabel('feature_x')
ax.set_ylabel('feature_y')

plt.show()
Output:
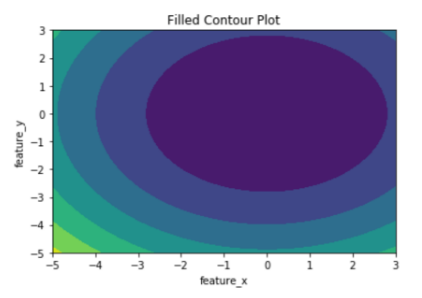
Explanation:
In the above example, the Numpy meshgrid() function creates a 2-dimensional grid containing the coordinates of the values in Z. X and Y have the same dimensions as Z. The Z array contains the height values on which the contour.
Thus, passing X, Y, and Z as arguments to the contourf() function, we get a filled contour plot. The title of the contour plot ‘Filled Contour Plot.’ The x-label and y – label is for the contour plot as ‘feature x’ and ‘feature y’, respectively.
Setting Colorbar Range with Matplotlib contourf() in Python
import numpy as np
import matplotlib.pyplot as plt
x = np.arange(20)
y = np.arange(20)
data = x[:,None]+y[None,:]

X,Y = np.meshgrid(x,y)
vmin = 0
vmax = 15

fig,ax = plt.subplots()
contourf_ = ax.contourf(X,Y,data, 400, vmin=vmin, vmax=vmax)
cbar = fig.colorbar(contourf_)
cbar.set_clim( vmin, vmax )
Output:

Explanation:
In the above example, the color bounds from the graphs are set with “vmin” and “vmax”, but the colorbar bounds are not modified. Passing contourf as an argument to the colorbar() method, we get to set the colorbar range for the contour created.
Plotting 3D contour with Matplotlib contourf() in Python
from mpl_toolkits.mplot3d import Axes3D
import matplotlib.pyplot as plt
import numpy as np
a=np.array([-3,-2,-1,0,1,2,3])
b=a
a,b=np.meshgrid(a,b)
fig = plt.figure()
axes = fig.gca(projection="3d")
axes.plot_surface(a,b,a**2+b**2,cmap="rainbow")
plt.contour(a,b,a**2+b**2,cmap="rainbow")
plt.show()
Output:

Explanation:
In this example, numpy and matplotlib library are imported. A numpy array is created to store A and B. After that, the meshgrid function is used, and A and B are passed inside it. The contour is then plotted to bypass 3 arguments: A, B, A**2+B**2. For three-dimensional contour plotting, module Axes3D from mpl_toolkits.mplot3d needs to be imported specifically.
Matplotlib contourf() v/s contour()
Both contourf() and contour() functions of the Matplotlib library are used for contour plotting in Python. The only difference between them is that the contourf() is used to plot filled contours while contour() only plots the contour lines. Below is an example to demonstrate Python’s Matplotlib contour() function.
import matplotlib.pyplot as plt
import numpy as np

feature_x = np.arange(0, 50, 2)
feature_y = np.arange(0, 50, 3)

# Creating 2-D grid of features
[X, Y] = np.meshgrid(feature_x, feature_y)

fig, ax = plt.subplots(1, 1)

Z = np.cos(X / 2) + np.sin(Y / 4)

# plots contour lines
ax.contour(X, Y, Z)

ax.set_title('Contour Plot')
ax.set_xlabel('feature_x')
ax.set_ylabel('feature_y')

plt.show()
Output:

Also Read: Matplotlib Quiver Plot
Conclusion:
In this article, we discussed contour plots with examples and implementations. Contour plots are widely used to visualize the mountain’s density, altitudes, or heights by representing its three-dimensional surface in a two-dimensional plane. Unlike the MATLAB version, contourf() cannot draw polygon edges. The contourf() function fills intervals that are closed at the top(i.e., includes the lowest values). You can refer to this article for clear and concise knowledge of Matplotlib contourf() in Python.
However, if you have any doubts or questions, do let me know in the comment section below. I will try to help you as soon as possible.
Happy Pythoning!