
In this article, we will learn about the numpy histogram() function in python provided by the Numpy library. Histograms are simply graphical representations of the frequency distribution of data. In fact, Numpy histogram() function represents rectangles of the same horizontal size corresponding to class intervals called bins. Likewise, variable height corresponds to frequency. With this in mind, let’s directly start with our discussion on np.histogram() function in Python.
Numpy histogram is a special function that computes histograms for data sets. This histogram is based on the bins, range of bins, and other factors. Moreover, numpy provides all features to customize bins and ranges of bins. In this post, we’ll look at the histogram function in detail.
Syntax of numpy histogram() function:
numpy.histogram(data, bins=10, range=None, normed=None, weights=None, density=None)Parameters
| Parameter | Description |
|---|---|
| data | input array |
| bins | number of equal width bins , default is 10 |
| range | sets lower and upper range of bins – optional parameter |
| normed | gives incorrect result for unequal bin width – optional parameter |
| weights | defines array of weights having same dimensions as data – optional parameter |
| density | if False result contain number of sample in each bin, if True result contain probability density at bin – optional parameter |
While writing the numpy histogram() function in python programs, the optional parameters can be avoided. The histogram() function takes only the input array and bins as two parameters. Moreover, the successive elements in the bin array serve as the boundary of each bin.
Example of numpy histogram() function in pyton:
import numpy as np

x = np.array([22,87,5,43,56,73,55,54,11,20,51,5,79,31,27])
np.histogram(x,bins = [0,20,40,60,80,100])
hist,bins = np.histogram(x,bins = [0,20,40,60,80,100])
print hist
print bins
Output:
[3 4 5 2 1]
[0 20 40 60 80 100]
In the above example, the np.histogram() function took the input array and the bin as its parameters. As a result, it returned the numerical frequency distribution of the data values in the input array taking bins’ values as class intervals.
Histogram() v/s Hist() function in Python
The histogram() function is provided by the Numpy library, whereas the matplotlib library provides the hist(). The Numpy histogram function is similar to the hist() function of the matplotlib library in terms of their use. At the same time, both of them are used to get the frequency distribution of data based on class intervals. The only difference is that the np histogram gives the numerical representation of the data during the hist() graphical representation.
Example of hist() function of matplotlib library
from matplotlib import pyplot as plt
import numpy as np

a = np.array([22,87,5,43,56,73,55,54,11,20,51,5,79,31,27])
plt.hist(a, bins = [0,20,40,60,80,100])
plt.title("histogram")
plt.show()
Output:

Numpy Histogram() 2D function
Numpy histogram2d() function computes the two-dimensional histogram two data sample sets. The syntax of numpy histogram2d() is given as:
numpy.histogram2d(x, y, bins=10, range=None, normed=None, weights=None, density=None). Where, x and y are arrays containing x and y coordinates to be histogrammed, respectively. The bin is an array containing class intervals for both x and y coordinates which by default is 10. It can be int or array_like or [int, int] or [array, array]. The bin specification: If int, the number of bins is (nx=ny=bins), array_like, the bin edges for the two dimensions (x_edges=y_edges=bins). Moreover, [int, int] as the number of bins in each dimension (nx, ny = bins). And [array, array], the bin edges are (x_edges, y_edges = bins). Also, all other parameters mentioned in the syntax are optional. And are usually omitted while implementing the histogram2d() function in python programs.
However, it has exact same use and function as that mentioned above for np.histogram() function. Numpy histogram2d() function returns:– H – ndarray of shape(nx, ny). Values in x are histogrammed along the first dimension and values in y are histogrammed along the second dimension. xedges – ndarray, shape(nx+1,). The bin edges along the first dimension. yedges – ndarray, shape(ny+1,). The bin edges along the second dimension.
Example of Numpy histogram2d() function:
from matplotlib.image import NonUniformImage
import matplotlib.pyplot as plt

#defining bin edges
xedges = [0, 1, 3, 5]
yedges = [0, 2, 3, 4, 6]

#create a histogram H with random bin content:
x = np.random.normal(2, 1, 100)
y = np.random.normal(1, 1, 100)
H, xedges, yedges = np.histogram2d(x, y, bins=(xedges, yedges))
H = H.T
Numpy Histogram() in Python for Equalization
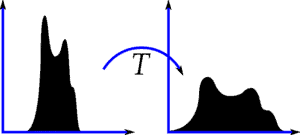
Brighter images have all pixels confined to high values. But good images will have pixels from all regions of the image. To get a good image of a brighter picture. Moreover, it is needed to stretch the histogram of the image to either end. This is what Histogram equalization means in simple terms. Refer to the image below for better understanding.
Generating 3D Histogram using numpy histogram()
<pre class="wp-block-syntaxhighlighter-code">xAmplitudes = #your data here
yAmplitudes = #your other data here

x = np.array(xAmplitudes)   #turn x,y data into numpy arrays
y = np.array(yAmplitudes)

fig = plt.figure()          #create a canvas, tell matplotlib it's 3d
ax = fig.add_subplot(111, projection='3d')

#make histogram stuff - set bins - I choose 20x20 because I have a lot of data
hist, xedges, yedges = np.histogram2d(x, y, bins=(20,20))
xpos, ypos = np.meshgrid(xedges[:-1]+xedges[1:], yedges[:-1]+yedges[1:])

xpos = xpos.flatten()/2.
ypos = ypos.flatten()/2.
zpos = np.zeros_like (xpos)

dx = xedges [1] - xedges [0]
dy = yedges [1] - yedges [0]
dz = hist.flatten()

<a href="http://www.pythonpool.com/matplotlib-cmap/" target="_blank" rel="noreferrer noopener">cmap</a> = cm.get_cmap('jet') # Get desired colormap - you can change this!
max_height = np.max(dz)   # get range of colorbars so we can normalize
min_height = np.min(dz)
# scale each z to [0,1], and get their rgb values
rgba = [cmap((k-min_height)/max_height) for k in dz]

ax.bar3d(xpos, ypos, zpos, dx, dy, dz, color=rgba, zsort='average')
plt.title("X vs. Y Amplitudes for ____ Data")
plt.xlabel("My X data source")
plt.ylabel("My Y data source")
plt.savefig("Your_title_goes_here")
plt.show()
</pre>

The above code snippet helps to generate a 3D histogram using the Np histogram() function. By giving inputs of your choice for x and y coordinates, you can generate a 3D histogram for your data set.
Conclusion
For the most part, This article covers all the details of the np histogram() function and its implementation in python programs addresses a variety of practical problems and provides solutions to them. In addition, Histogram equalization and creating 2d and 3d histograms are to name some of them. However, to obtain the graphical histograms. The hist() function of the matplotlib library has to be used along with the histogram() function of the Numpy module. You can also learn multiple numpy tutorials on our websites please visit it.
However, if you have any doubts or questions do let me know in the comment section below. I will try to help you as soon as possible.
Happy Pythoning!