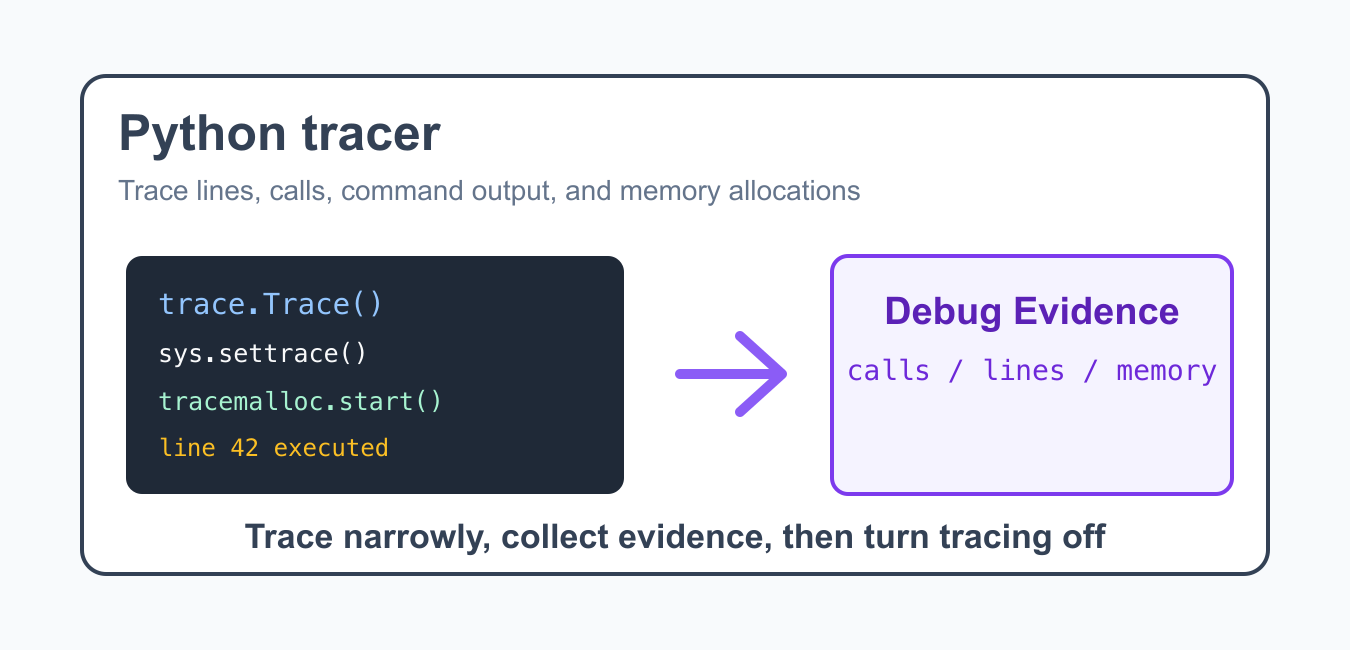
Python tracing records execution events while a program runs. The standard-library trace module can print executed lines or collect execution counts, while sys.settrace() lets advanced code install a custom tracing hook. tracemalloc is related but solves a different problem: it traces Python memory allocations rather than ordinary line execution.
Quick answer
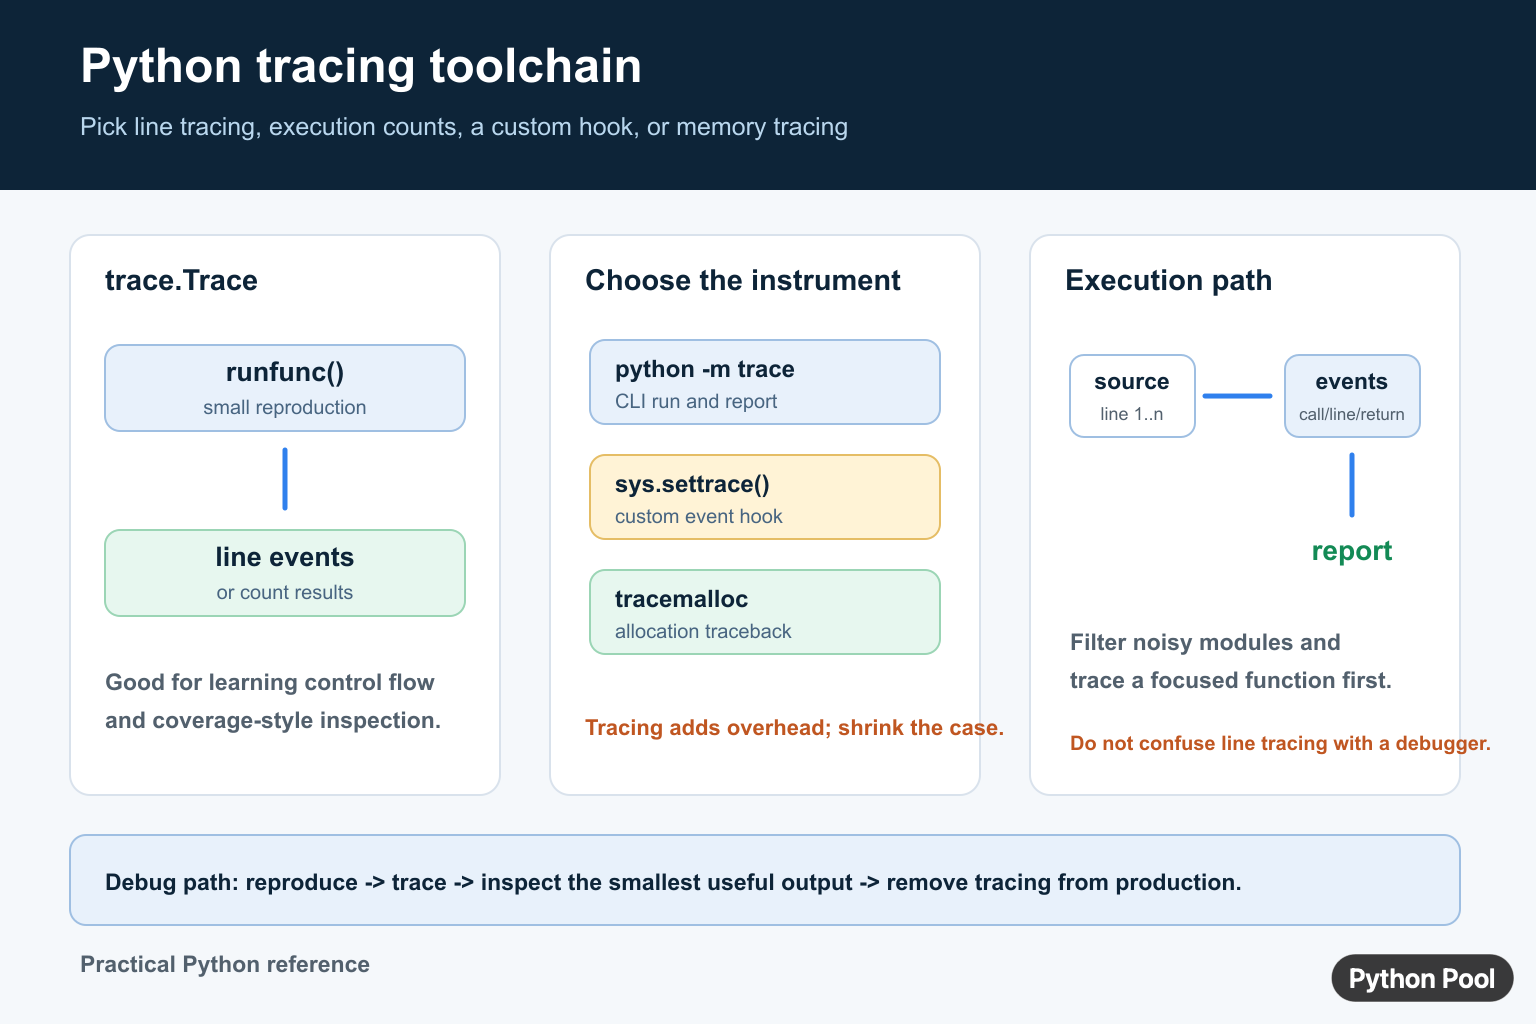
Use trace.Trace(trace=True) or python -m trace --trace script.py to see line execution. Use count=True for coverage-style counts. Use sys.settrace() only when a custom event hook is necessary, because tracing adds overhead. The official trace module documentation describes the class, command-line interface, and result reporting.
Trace a small function with trace.Trace
Trace.runfunc() runs a callable under the tracer. Start with a small reproduction so that the output describes the branch you are investigating rather than the entire application startup.
import trace

def greet(name):
    message = f"Hello, {name}"
    return message.upper()

tracer = trace.Trace(trace=True, count=False)
result = tracer.runfunc(greet, "Python Pool")
print(result)
Line tracing is useful for confirming whether a branch ran, whether a callback fired, or where a function returned. It is diagnostic output, not a replacement for a debugger with breakpoints and state inspection.
Collect execution counts
Set trace=False and count=True when you want coverage-style counts instead of every line printed to the terminal. The result object can write annotated source and count reports.
import trace

def total(numbers):
    answer = 0
    for number in numbers:
        answer += number
    return answer

tracer = trace.Trace(trace=False, count=True)
tracer.runfunc(total, [1, 2, 3])
results = tracer.results()
print(type(results).__name__)
Counts show which lines executed during one run; they do not prove that every input path is correct. Use a test suite and a coverage tool when you need repeatable coverage thresholds.
Run trace from the command line
The module can run a script without changing that script’s source. For a short line-by-line trace, use python -m trace --trace app.py. For counts, use the module’s count options and write the report to a directory. The exact interpreter matters, so run the command inside the same virtual environment as the application.
Install a custom hook with sys.settrace
sys.settrace() receives frames, event names, and event arguments. A global trace function can return a local trace function for events within that frame. Return None when a frame should no longer be traced.
import sys

def trace_calls(frame, event, arg):
    if event == "call":
        print("call:", frame.f_code.co_name)
    return trace_calls

sys.settrace(trace_calls)

def add(left, right):
    return left + right

print(add(2, 3))
sys.settrace(None)
Custom hooks affect the interpreter while installed and can produce a large amount of output. Always remove the hook with sys.settrace(None) when the diagnostic scope ends. Protect shared state if the program uses threads.
Trace memory allocations with tracemalloc
Use tracemalloc when the question is where memory was allocated or how snapshots differ. It does not tell you which source lines executed in the same way as trace.
import tracemalloc

tracemalloc.start()
values = [str(number) for number in range(1000)]
current, peak = tracemalloc.get_traced_memory()
print(current, peak)
tracemalloc.stop()
Keep tracing useful
Reproduce the smallest failure, filter noisy modules when possible, record the interpreter version, and remove tracing from production paths after the investigation. For adjacent debugging workflows, see the guides to Python inspect, difflib, and Python timer tools.
Understand trace events
A trace function can receive events such as call, line, return, and exception. The frame gives access to the executing code object, local namespace, global namespace, and current line number. The event argument has different meaning for different event types, so a custom hook should branch explicitly instead of treating every event as the same shape.
import sys

def trace_lines(frame, event, arg):
    if event == "line":
        print(frame.f_code.co_name, frame.f_lineno)
    return trace_lines

sys.settrace(trace_lines)
answer = sum([1, 2, 3])
sys.settrace(None)
print(answer)
Returning a local trace function keeps tracing active for the frame. Returning None stops local tracing. Be cautious when inspecting or modifying frame locals: a diagnostic hook should observe execution rather than change application state.
Use filters and result files
The command-line interface supports tracing a script and writing count information for later inspection. Filtering standard-library or third-party modules keeps a report focused on the code under investigation. Use a temporary output directory and record which command, environment, and input produced the report so that another run can be compared meaningfully.
Count reports are snapshots of the paths exercised by a particular run. A line with zero hits may be a genuine dead branch, or it may simply require an input that the reproduction did not include. Combine trace output with tests and code review before deleting a branch.
Know when another tool is better
Use a debugger when you need to pause and inspect state interactively. Use a profiler when the question is where time is spent. Use a coverage tool when you need a repeatable measurement across a test suite. Use tracemalloc when allocation snapshots or traceback origins explain memory growth. The trace module is most useful when you need a direct view of whether a line or function executed.
Limit the production risk
Tracing can be expensive in a web server, worker pool, or asynchronous application because every traced event adds work. Install it only within a deliberate diagnostic scope, protect logs from sensitive values, and always remove a global hook in cleanup code. A short, deterministic reproduction is safer and more informative than tracing a live process indefinitely.
Also record whether the trace ran in the main interpreter thread or inside a worker. A hook installed with sys.settrace() has thread-specific implications, and an incomplete setup can make a report appear to miss code that actually ran elsewhere. State the scope in the diagnostic notes so an absent event is not mistaken for proof that a branch never executed.
Keep trace output separate from normal application logs so diagnostic lines cannot be mistaken for business events.
Frequently Asked Questions
What is the Python trace module used for?
The trace module prints executed lines or collects execution counts for a Python program and its functions.
How do I trace a Python script from the command line?
Run python -m trace –trace script.py with the same interpreter and environment used by the application.
What is the difference between trace and tracemalloc?
trace observes execution events, while tracemalloc records Python memory allocation traces and snapshots.
Why should tracing be limited to a small reproduction?
Tracing adds runtime overhead and can produce noisy output, so a focused case makes the execution path easier to inspect.