Matplotlib Markers: Style plot() and scatter() Points
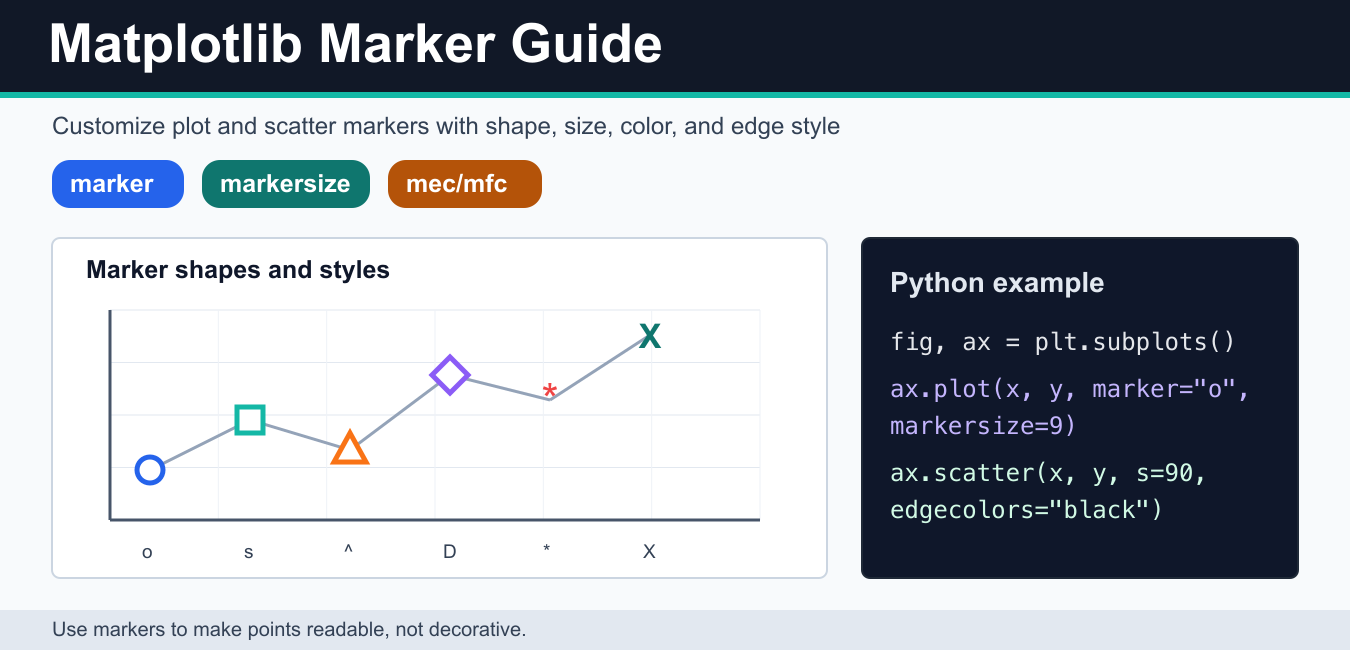
Customize Matplotlib markers with shape, size, face and edge colors, transparency, scatter sizing, and reusable MarkerStyle examples.
Learn Matplotlib with tutorials for plots, labels, grids, colors, figures, legends, annotations, exports, and visualization examples in Python.
Customize Matplotlib markers with shape, size, face and edge colors, transparency, scatter sizing, and reusable MarkerStyle examples.

Use Matplotlib quiver() to draw vector fields with correct x-y components, scale, angles, color, grids, and readable arrow keys.

Create Matplotlib heatmaps with imshow(), colorbars, tick labels, annotations, colormaps, and readable correlation matrices.

Control Matplotlib figure width and height in inches, convert to pixels with DPI, and protect labels during export.

Create readable Matplotlib bar charts with bar(), barh(), grouped or stacked series, labels, error bars, and export-ready axis choices.

Display images, heatmaps, masks, and arrays with imshow() while controlling color scale, coordinates, interpolation, and aspect.