Do you know that images are represented in the form of numbers in computer programming? Any of the operations that we perform on an image using programming languages, we perform on the arrays of numbers. We can also visualize those images using the imshow function of the matplotlib library. Matplotlib is a library in python that is built over the numpy library and is used to represent different plots, graphs, and images using numbers.
The basic function of Matplotlib Imshow is to show the image object. As Matplotlib is generally used for data visualization, images can be a part of data, and to check it, we can use imshow. Moreover, the imshow method is also famous for the OpenCV module to show the images.
GreyScale images can be visualized using a 2-Dimensional array, and colored images are displayed using a 3-Dimensional array. Using Matplotlib, we can represent both colored and black and white images. We can also perform many different operations on the image using the variety of parameters of the imshow function. Let us study everything in detail.
Syntax of Matplotlib Imshow
To use the matplotlib library, we first need to install matplotlib using – pip install matplotlib. We then need to import the submodule pyplot, which contains the imshow function.
After you have successfully installed matplotlib library, use the below code to use the imshow function.
plt.imshow(X, cmap=None, norm=None, aspect=None, interpolation=None, alpha=None, vmin=None, vmax=None, origin=None, extent=None)
Parameters-
X – It is the data that we want to display using imshow. This can be in the form of lists or array. For Grey images, it is a 2-D array, and for colored images, we use 3-D images. Every element in the array acts as a pixel.
Cmap– This parameter is used to give colors to non-colored images. We can pass any of the below values as the argument for this parameter. If the image is already colored, the cmap parameter is ignored.

Norm– This parameter is used to normalize the color values from 0.0 to 1.0. This is ignored in the case of colored images.
Aspect – This parameter is used to adjust the size of images. There are two options for arguments – auto and equal. We will better understand when we look at an example.
Alpha– If we want to change the transparency of the image, we can use this parameter. For opaque image, use ‘1’ as the argument for this parameter. And for a completely transparent image, use 0. The range is 0-1.
Origin– If we want to change the origin ((0,0)) from upper to lower, we can set the value of origin parameter as ‘lower.’
There are many more parameters in imshow, but these are the most important ones.
Return Type-
`~matplotlib.image.AxesImage`
Using the Matplotlib Imshow Function
Before directly jumping into displaying some already existing images, let us see how we can create our images using numpy array and display it using imshow function.
Creating a chessboard
We know that the chessboard is an 8×8 matrix with only two colors i.e., white and black. So, let us use numpy to create a numpy array consisting of two numbers 0 and 1. In programming, one is used for bright color, and 0 is used for dark/dull colors.
import numpy as np
import matplotlib.pyplot as plt

# create a 8x8 matrix of two numbers-0 and 1.
# O represents dark color and 1 represents bright color
arr=np.array([[1,0]*4,[0,1]*4]*4)
print(arr)
# use the imshow function to display the image made from the above array
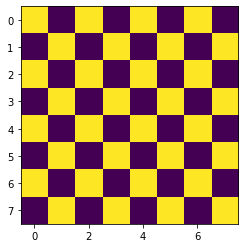
plt.imshow(arr)
Output-
[[1 0 1 0 1 0 1 0]
 [0 1 0 1 0 1 0 1]
 [1 0 1 0 1 0 1 0]
 [0 1 0 1 0 1 0 1]
 [1 0 1 0 1 0 1 0]
 [0 1 0 1 0 1 0 1]
 [1 0 1 0 1 0 1 0]
 [0 1 0 1 0 1 0 1]]

As we can see that we have got the desired matrix, but the colors are not adequate. Also, we know that to color a 2-d array, we use the cmap parameter.
import numpy as np
arr=np.array([[1,0]*4,[0,1]*4]*4)
# use the 'gray' argument in cmap argument to make the image black and white
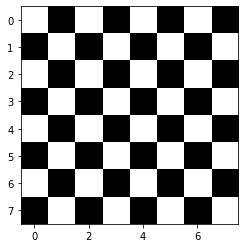
plt.imshow(arr,cmap="gray")

One more important thing about this method is that the origin starts at the top left corner. We can change it using the ‘origin’ parameter.
import numpy as np
arr=np.array([[1,0]*4,[0,1]*4]*4)
# to change the origin of the image from upper left to lower left,
# use the origin parameter.
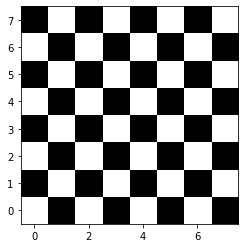
plt.imshow(arr,origin="lower",cmap="gray")

We can clearly observe the change between the above two images. Now the origin starts from lower left.
Let us now show an already existing image using imshow.
Displaying a cat using Matplotlib imshow
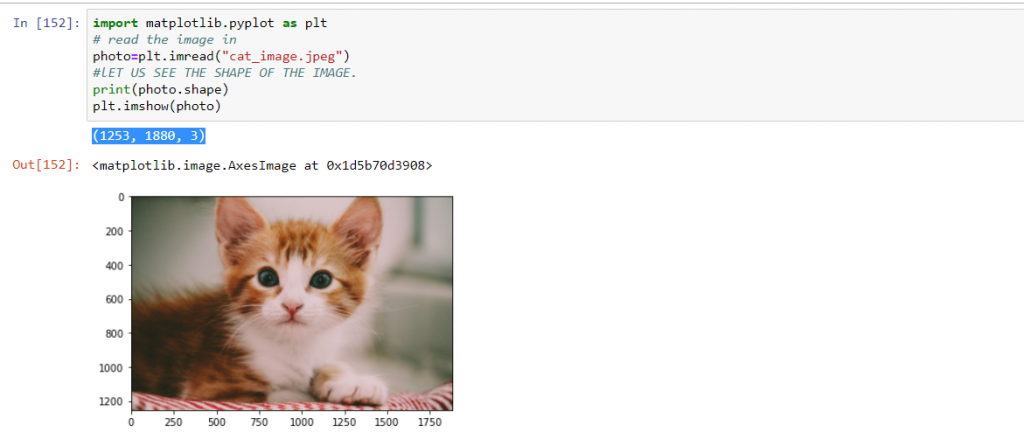
Let us now see how we can display the following cat using the imshow function.

For displaying this image, we first need to read this image using the imread function of matplotlib.pyplot library.
We have to give the path of this image to the imread function. I am working in the same location where the image is present, so I can just write the name of the image along with its extension.
import matplotlib.pyplot as plt
# read the image in
photo=plt.imread("cat_image.jpeg")
#lET US SEE THE SHAPE OF THE IMAGE.
print(photo.shape)
plt.imshow(photo)
(1253, 1880, 3)

As we know that colored images are stored in a 3-d array (the third dimension represents RGB( Red, Green, Blue) colors).
We can make this image more or less transparent using the alpha parameter.
import matplotlib.pyplot as plt
# read the image in
photo=plt.imread("cat_image.jpeg")
# set the transparency to 0.5
plt.imshow(photo,alpha=0.5)

Must Read:
- How to Convert String to Lowercase in
- How to Calculate Square Root
- User Input | Input () Function | Keyboard Input
- Best Book to Learn Python
Conclusion
We have studied how to show the images using a matplotlib imshow function. We have made changes in the image using various parameters available. You can be more creative and use these concepts to create more cool images.
Try to run the programs on your side and let us know if you have any queries.
