
Hello geeks!! In this article, we will learn about the matplotlib background color. We will see the different ways to change or modify the background color of a matplotlib graph. So, without wasting any time, let us get into the topic.
Prerequisites for changing background color:
- Matplotlib – Matplotlib is a plotting library used in the Python library with NumPy as an extension.
- NumPy – It is a Python library that is used to work with an array. It can also work for linear algebra, Fourier transform, and matrices.
The figure below shows that the plot comprises the X-axis, Y-axis, plot title, and axes. The background color of the plot is white by default. If we have to change the plot’s background color to make it look more attractive, we have to make axes object axes() after plotting the graph.

Approach for changing the background color:
- At first, we have to import the respective module
- Secondly, we have to load or create data
- Next, we have to plot a regular graph
- Then, create an axes object
- Finally, set an attribute as a set_facecolor() to the required color. It could accept both the color code and the name of the color.
Syntax:
Axes.set_facecolor(self, color)Parameters:
- color: The color of the background
Illustrated Example:
So now let us understand with suitable example:
Example 1: Matplotlib graph with default background
import matplotlib.pyplot as plt
Marks = [50, 60, 70, 80, 90]
Grade = ['B', 'B', 'B+', 'B+', 'A']
plt.plot(student_marks, student_grade)
plt.xlabel("Marks", fontweight='bold')
plt.ylabel("Grade", fontweight='bold')
plt.show()
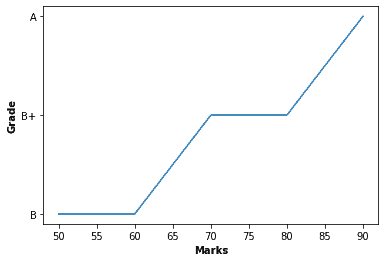
- According to the above example, we can see that we have imported library matplotlib to plot the graph.
- Next, we have declared two lists,’ Marks’ and ‘grade,’ and assigned them with certain values accordingly.
- Then we used the plot() method to plot the graph with the given parameter.
- We then use xlebel and ylebel to lebel X and Y-axis, respectively.
- And finally, we have used the show() method to display the corresponding graph.
Example 2: Matplotlib graph with Custom background:
import matplotlib.pyplot as plt
Marks = [50, 60, 70, 80, 90]
Grade = ['B', 'B', 'B+', 'B+', 'A']
plt.plot(Marks,Grade)
plt.xlabel("Marks", fontweight='bold')

plt.ylabel("Grade", fontweight='bold')
ax = plt.axes()
ax.set_facecolor("#99c2ff")
plt.show()
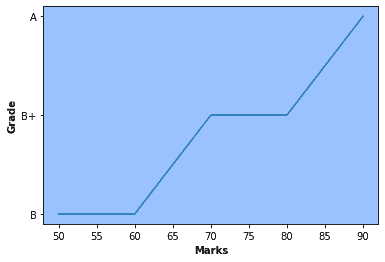
In this example, we have the same steps are the previous example. The only difference is that we have used the axes() method object to change the figure’s background color using the facecolor() method.
Example 3: Setting Outer and Inner color of the plot
import matplotlib.pyplot as plt
Marks = [50, 60, 70, 80, 90]
Grade = ['B', 'B', 'B+', 'B+', 'A']


plt.figure(facecolor='#008060')
plt.plot(Marks,Grade)
plt.xlabel("Marks", fontweight='bold')
plt.ylabel("Grade", fontweight='bold')
ax = plt.axes()
ax.set_facecolor("#99c2ff")
plt.show()
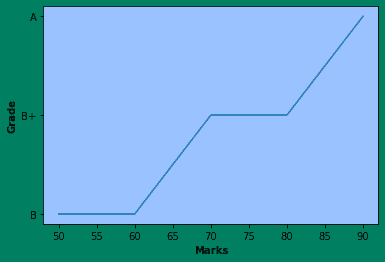
As you can see, in this example, we have set both an outer color and an inner color as a background color of our plot. We have used the ‘facecolor’ attribute of ‘plt.figure()’ to set the background color of the plot’s outer area. And then, like the previous example, we used the set_facecolor() method of the axes() object to set the background color of the plot.
Conclusion:
With this, we come to an end with this article. These are the various ways to change the background color in matplotlib. I hope that you were able to gain some knowledge from this article.
However, if you have any doubts or questions, do let me know in the comment section below. I will try to help you as soon as possible.
Happy Pythoning!