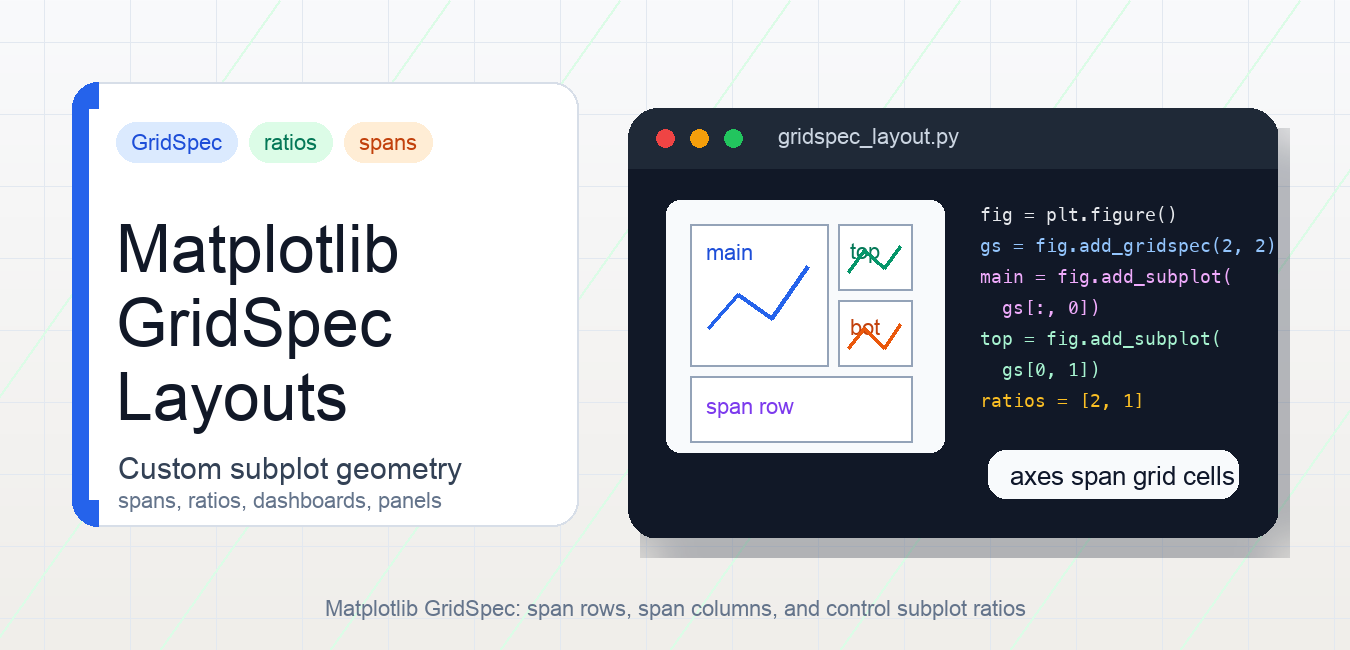
Quick answer: GridSpec defines subplot geometry as a rows-by-columns grid. Indexing its SubplotSpec lets an axes span rows or columns, while width_ratios, height_ratios, wspace, hspace, and constrained layout control how the finished figure uses space. Use it when layout geometry is irregular; use plt.subplots() for a regular grid.
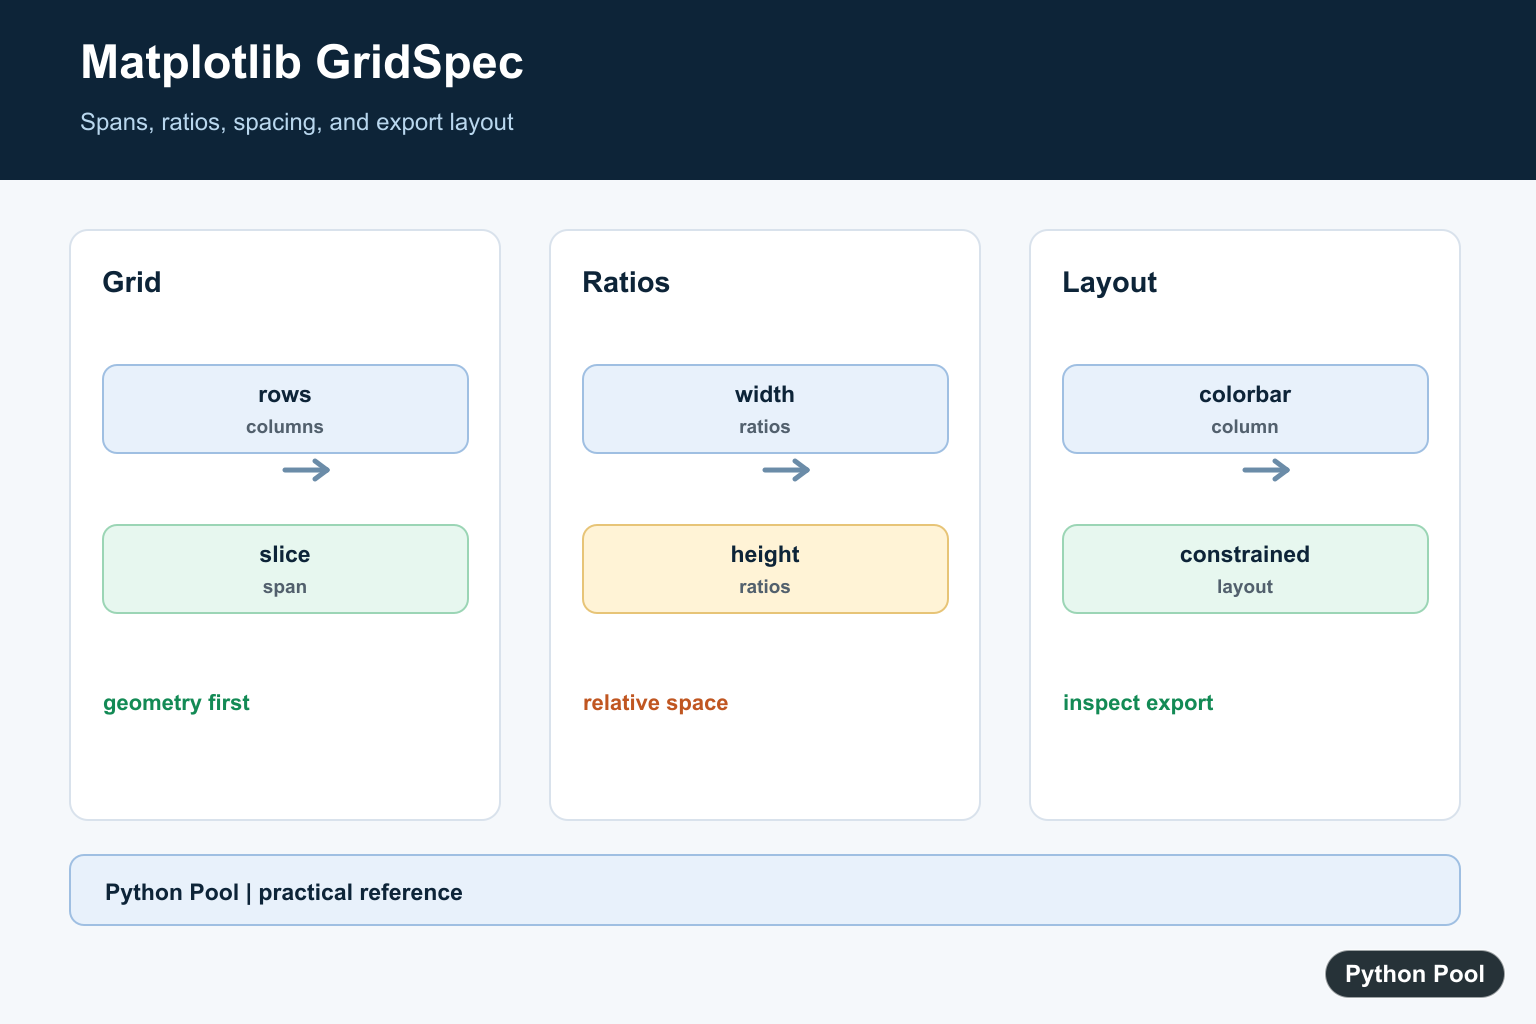
Matplotlib GridSpec gives you precise control over subplot geometry. Regular plt.subplots() is enough for simple rows and columns, but GridSpec is better when one axes should span multiple rows, another should be narrow, or a figure needs a dashboard-style layout.
Use GridSpec when the layout itself carries meaning: a large main chart with small side panels, a top summary plot over two lower plots, or a shared colorbar column next to several axes. If you only need to stop labels from overlapping, start with Matplotlib subplot spacing or Matplotlib tight_layout() instead.
Basic GridSpec example
The most readable modern pattern is to create a figure, add a grid with fig.add_gridspec(), and then create each axes from a slice of that grid. Think of the grid as a layout template. Each axes can occupy one cell, a full row, a full column, or a rectangular block of cells.
import matplotlib.pyplot as plt

fig = plt.figure(layout="constrained")
grid = fig.add_gridspec(2, 2)

main_ax = fig.add_subplot(grid[:, 0])
top_ax = fig.add_subplot(grid[0, 1])
bottom_ax = fig.add_subplot(grid[1, 1])

main_ax.plot([1, 2, 3], [2, 4, 3])
top_ax.plot([1, 2, 3], [3, 1, 2])
bottom_ax.plot([1, 2, 3], [1, 3, 2])

plt.show()
The expression grid[:, 0] means “use every row in the first column.” That creates one large axes on the left. grid[0, 1] and grid[1, 1] create two smaller axes on the right. This is the main advantage of GridSpec: you can describe layout with normal row and column indexing instead of trying to force every subplot into the same size.
Control width and height ratios
width_ratios and height_ratios control the relative size of grid columns and rows. They are not pixel values. A ratio of [2, 1] means the first column is twice as wide as the second column.
fig = plt.figure(figsize=(8, 4), layout="constrained")
grid = fig.add_gridspec(
    2,
    2,
    width_ratios=[2, 1],
    height_ratios=[1, 1],
)

wide_ax = fig.add_subplot(grid[:, 0])
small_top = fig.add_subplot(grid[0, 1])
small_bottom = fig.add_subplot(grid[1, 1])
Use ratios when one chart is the focus and the others provide context. For figure size basics, see Matplotlib figsize. If proportions inside an axes look wrong after the layout is correct, check Matplotlib aspect ratio.
Create a dashboard-style layout
GridSpec works well for compact dashboards. The example below places a large chart across the top row and two supporting charts below it.
fig = plt.figure(layout="constrained")
grid = fig.add_gridspec(2, 2)

summary_ax = fig.add_subplot(grid[0, :])
left_ax = fig.add_subplot(grid[1, 0])
right_ax = fig.add_subplot(grid[1, 1])

summary_ax.set_title("Summary")
left_ax.set_title("Left detail")
right_ax.set_title("Right detail")
The slice grid[0, :] spans the full first row. This is a common layout for reports where the top plot explains the overall trend and the lower plots show supporting detail. Name axes by purpose rather than position when the figure becomes more complex; summary_ax and detail_ax are easier to maintain than ax1 and ax2.
Use GridSpec with images and colorbars
GridSpec is also useful when an image-like plot needs a nearby colorbar or a narrow annotation panel. You can reserve a small column for the colorbar instead of squeezing it into the main axes.
fig = plt.figure(layout="constrained")
grid = fig.add_gridspec(1, 2, width_ratios=[20, 1])

image_ax = fig.add_subplot(grid[0, 0])
colorbar_ax = fig.add_subplot(grid[0, 1])

image = image_ax.imshow([[1, 2], [3, 4]])
fig.colorbar(image, cax=colorbar_ax)
This pattern works well with heatmaps, filled contours, and pseudocolor plots. For related plot types, compare Matplotlib contourf() and Matplotlib pcolormesh.
GridSpec vs subplots
Use plt.subplots() when every axes has the same basic size and the same row-column pattern. Use GridSpec when axes need to span cells, columns need different widths, rows need different heights, or one panel should be reserved for a legend, colorbar, or annotation.
| Need | Best tool |
|---|---|
| Simple 2 by 2 figure | plt.subplots() |
| One plot spans two rows | GridSpec |
| Narrow colorbar column | GridSpec |
| Labels overlap | layout="constrained", tight_layout(), or spacing controls |
Common GridSpec mistakes
A common mistake is to use GridSpec for problems that are really spacing problems. If all axes should be the same size and only the labels overlap, fix spacing instead of adding layout complexity. Another mistake is forgetting that slices are zero-based. grid[0, :] is the first row, not the second row. When a layout is hard to reason about, sketch the rows and columns before writing the indexing expressions.
Another practical issue is mixing too many layout systems. For new figures, use layout="constrained" with GridSpec first. Avoid adding manual spacing until you see a real overlap. If you do need manual control, change one setting at a time so you can tell whether margins, width ratios, height ratios, or tick labels are causing the problem.
Practical tips
Keep GridSpec layouts readable by naming axes for their role, such as main_ax, colorbar_ax, or summary_ax. Prefer layout="constrained" for new figures because it handles many label, title, and colorbar spacing issues automatically. Use manual spacing only when constrained layout does not give enough control.
After the layout is correct, tune the contents of each axes separately. For axis grid styling, read Matplotlib grid. For tick and limit cleanup, see Matplotlib xticks and Matplotlib ylim.
Official Matplotlib references
- Matplotlib GridSpec documentation
- Matplotlib gridspec API
- Figure.add_gridspec documentation
- Figure.add_subplot documentation
- pyplot.subplots documentation
- GridSpec multicolumn gallery example
- GridSpec customization gallery example
- Constrained layout guide
Create A Spanning Layout
Make a GridSpec from a figure, then pass cell slices to add_subplot. The slice expresses which rows and columns the axes owns and keeps the layout definition separate from the plotting calls.
import matplotlib.pyplot as plt

fig = plt.figure(constrained_layout=True)
grid = fig.add_gridspec(2, 2)
main = fig.add_subplot(grid[:, 0])
side = fig.add_subplot(grid[0, 1])
bottom = fig.add_subplot(grid[1, 1])
main.set_title("main")
side.set_title("side")
bottom.set_title("bottom")
Set Relative Widths And Heights
Ratios are relative, not absolute pixels. A column with ratio 2 receives twice the share of a column with ratio 1 after the available space and gaps are accounted for.
import matplotlib.pyplot as plt

fig = plt.figure(constrained_layout=True)
grid = fig.add_gridspec(2, 3, width_ratios=[2, 1, 1], height_ratios=[1, 2])
for row in range(2):
    for column in range(3):
        ax = fig.add_subplot(grid[row, column])
        ax.set_title(f"{row}, {column}")
Reserve A Colorbar Column
A narrow GridSpec column can hold a colorbar or legend-like axis without squeezing the main plot unpredictably. Keep the colorbar axis separate so the data axes share a clear geometry.
import matplotlib.pyplot as plt
import numpy as np

fig = plt.figure(constrained_layout=True)
grid = fig.add_gridspec(1, 2, width_ratios=[20, 1])
ax = fig.add_subplot(grid[0, 0])
colorbar_ax = fig.add_subplot(grid[0, 1])
image = ax.imshow(np.arange(9).reshape(3, 3))
fig.colorbar(image, cax=colorbar_ax)
Choose Layout Management Deliberately
constrained_layout can reserve space for labels and colorbars automatically. If you use manual subplot parameters or tight_layout instead, render the final export and check the exact figure size because text and spans can otherwise collide.
import matplotlib.pyplot as plt

fig = plt.figure(figsize=(8, 4), constrained_layout=True)
grid = fig.add_gridspec(1, 2, wspace=0.15)
left = fig.add_subplot(grid[0, 0])
right = fig.add_subplot(grid[0, 1])
left.set_xlabel("long x label")
right.set_ylabel("long y label")
fig.savefig("gridspec.png", dpi=160)
Use the official GridSpec reference and SubplotSpec reference for indexing, ratios, and spacing. Related guides include subplot spacing and tight_layout().
For related figure geometry and spacing, compare current Axes inspection, subplot spacing, and tight_layout() when a custom grid needs readable labels.
Frequently Asked Questions
What is Matplotlib GridSpec?
GridSpec defines a rows-by-columns subplot grid whose cells can be indexed to create axes with custom spans and relative sizes.
How do I make one subplot span multiple rows?
Create a GridSpec and pass a slice such as gs[:, 0] or gs[0:2, 1] to fig.add_subplot() to select the cells the axes should occupy.
What do width_ratios and height_ratios do?
They set relative column widths and row heights; each value is divided by the sum of the ratios to determine its share of the available space.
Should I use GridSpec or plt.subplots()?
Use plt.subplots() for regular grids and GridSpec when spans, unequal panel sizes, nested layouts, or a dedicated colorbar region make geometry part of the design.