Hello programmers, in today’s article, we will discuss the Matplotlib ylim() in Python. The Matplotlib library in Python is a numerical – mathematical extension for the NumPy library. The Pyplot module of the Matplotlib library is a state-based interface providing MATLAB-like features. The matplotlib.pyplot.ylim() function is used to get or set the y-limits of the current axes. Before we cite examples for the matplotlib ylim() function, let me briefly brief you with the syntax and return type.
Syntax of Matplotlib ylim()
matplotlib.pyplot.ylim(*args, **kwargs)
Parameters:
- bottom: This parameter sets the ylim to bottom.
- top: This parameter sets the ylim to top.
- **kwargs: Text properties that are used to control the appearance of the labels.
Return type
The matplotlib ylim() function returns:
bottom, top : The tuple of the new y-axis limits.
Example of Matplotlib ylim() in Python
# Implementation of matplotlib function
import matplotlib.pyplot as plt
import numpy as np
ax = plt.subplot(111)
t = np.arange(0.0, 5.0, 0.01)
s = np.cos(2 * np.pi * t)
line, = plt.plot(t, s, lw = 2)
plt.annotate('local max', xy =(2, 1),
xytext =(3, 1.5),
arrowprops = dict(facecolor ='black',
shrink = 0.05), )
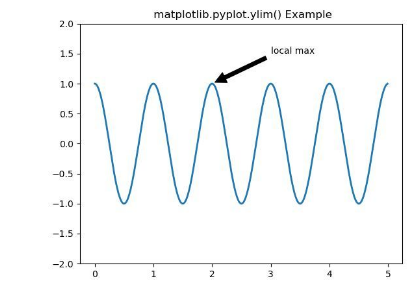
plt.ylim(-2, 2)
plt.title(" matplotlib.pyplot.ylim() Example")
plt.show()
OUTPUT:
EXPLANATION:
In the above example, first, the subplot of the figure is defined. Then the figure plots by passing parameters to the plt.plot() function. Also, annotation added for the plot using the plt.annotate() function. The text to be annotated is ‘local max’ placed at the position x = 3 and y = 1.5. Finally, we have set the Matplotlib ylim as plt.ylim(-2, 2). We get the y -limits for the y-axis from -2 to 2. Thus, -2 is the bottom limit, and 2 is the top limit for the y – axis.
Matplotlib ylim() default
import matplotlib.pyplot as plt
fig = plt.figure()
a1 = fig.add_axes([0,0,1,1])
import numpy as np
x = np.arange(1,10)
a1.plot(x, np.log(x))
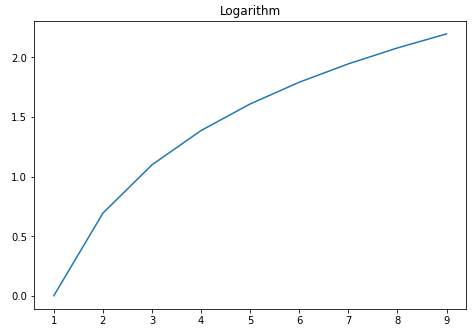
a1.set_title('Logarithm')
plt.show()
OUTPUT:
EXPLANATION:
In the above example, an array ‘x’ is defined using np.arrange(1, 10). And it is plotted bypassing the np.log(x) argument to the a1.plot() function. Since log(x) is used, a logarithmic plot is obtained. But, the limits for the x-axis and y-axis have not been mentioned explicitly. So the plot takes default values of xlim() and ylim(). As a result, the limit of the x-axis is from 1 to 9. And the bottom limit of the y-axis is 0, and 2.0 is the top limit. To mention limits for the y-axis as per our choice, the set_ylim() method exists.
Set axis range using Matplotlib ylim()
import matplotlib.pyplot as plt
import numpy as np
# creating an empty object
a= plt.figure()
axes= a.add_axes([0.1,0.1,0.8,0.8])
# adding axes
x= np.arange(0,11)
axes.plot(x,x**3, marker='*')
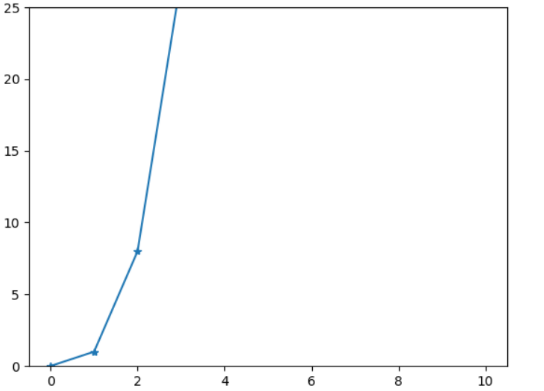
axes.set_ylim([0,25])
plt.show()
OUTPUT:
EXPLANATION:
In the above example, we have created a plot of x-coordinates of 0 to 10. The y-coordinates are to be the cube of each of these x-coordinates. We thus modify the range of the y-coordinates from 0 to 25 by using the set_ylim() function. The set_ylim() function takes two arguments, i.e., the lower limit as 0 and the upper limit as 25, to change the y-axis range.
Matplotlib ylim() in Python to reverse axis
import numpy as np
import matplotlib.pyplot as plt

x=np.linspace(-3,3,100)
y=3*x+4

plt.plot(x, y)
plt.title("Reverted axes")
plt.xlim(max(x),min(x))
plt.ylim(max(y),min(y))

plt.show()
OUTPUT:
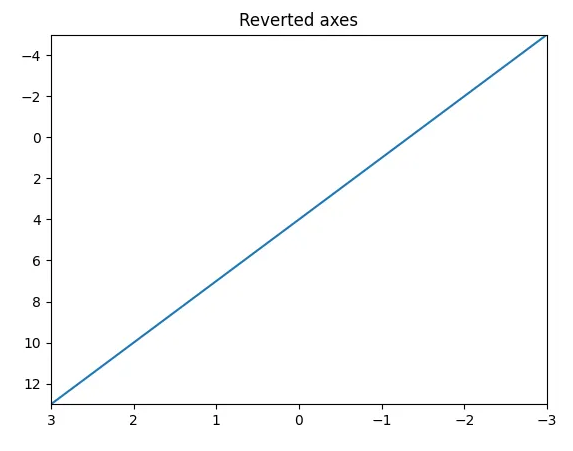
EXPLANATION:
The xlim() and ylim() functions are used to set or get limits for X-axis and Y-axis. If we pass the maximum value in the axis as the lower limit and the minimum value in the axis as the upper limit in the above functions, we get a reverted axis. We have passed max(x) as the lower limit and min(x) as the upper limit, which consequently reverses the axis.
Conclusion:
In this article, we learned about implementing the Matplotlib ylim() in python programs. We discussed how to set axis range and also reverse axis using the ylim() function. When the limits of axes are not mentioned, it uses the default value of xlim() and ylim() for the plot. Refer to this article in case of any queries regarding the Matplolib ylim() function.
However, if you have any doubts or questions, do let me know in the comment section below. I will try to help you as soon as possible.
Happy Pythoning!