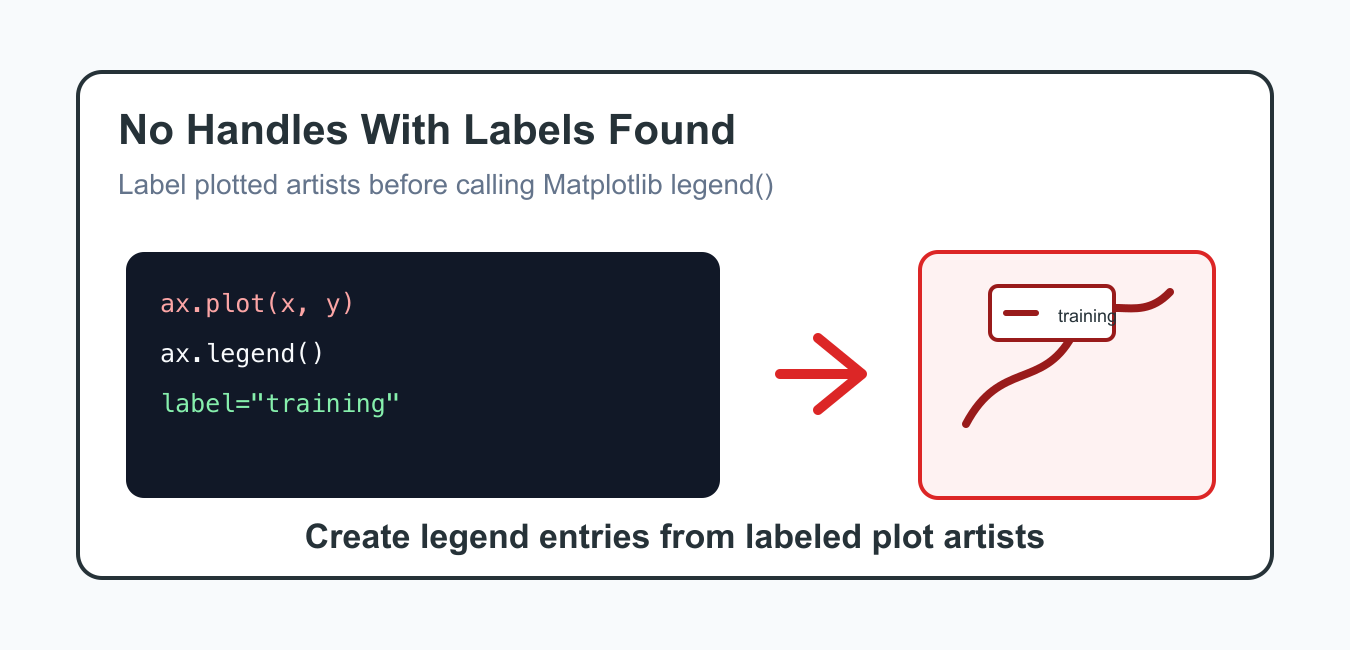
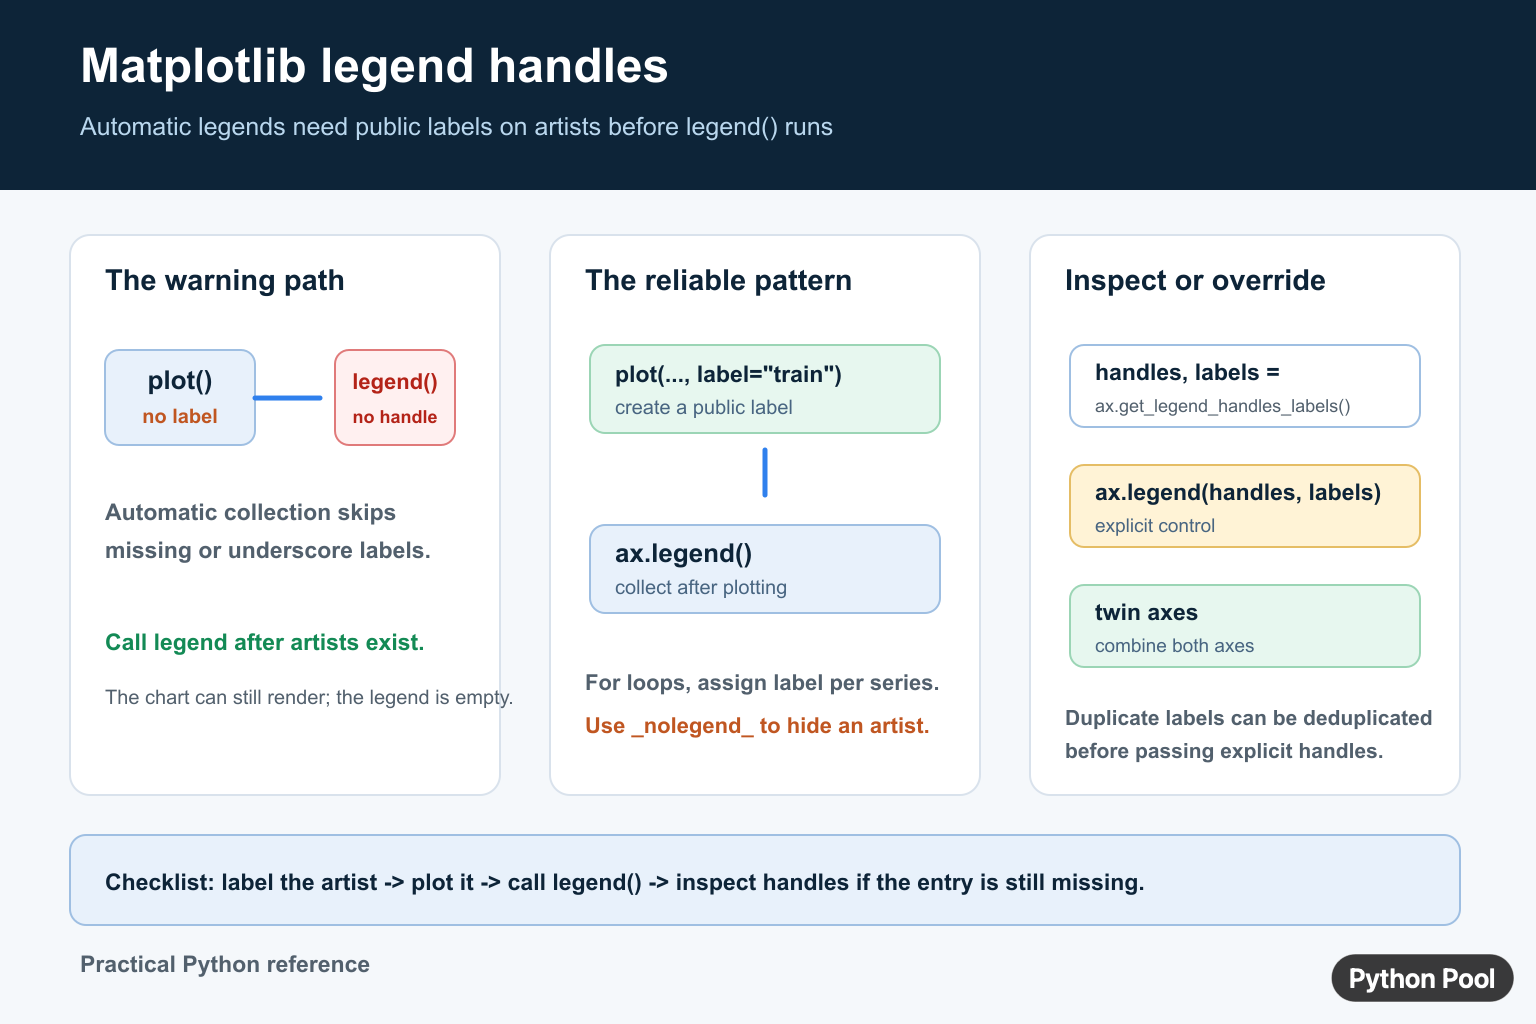
Matplotlib prints No handles with labels found to put in legend when legend() cannot find plotted artists with public labels. The common causes are a missing label, a label that starts with an underscore, or a call to legend() before the artists are created. The chart can still render; the automatic legend simply has no entries to show.
Quick answer
Give each plotted line, scatter collection, bar container, or patch a public label, then call ax.legend() after plotting. Matplotlib’s legend API and legend guide document automatic and explicit handle selection.
Why the warning happens
Automatic legend collection looks for artists with labels that are not private. A line created without a label has an internal label that begins with an underscore, so Matplotlib intentionally skips it.
import matplotlib.pyplot as plt

figure, axis = plt.subplots()
axis.plot([1, 2, 3], [2, 4, 6])
axis.legend()
Calling legend() in this state produces no useful entry. The order matters too: a legend created before the plotting call cannot automatically include an artist that does not exist yet.

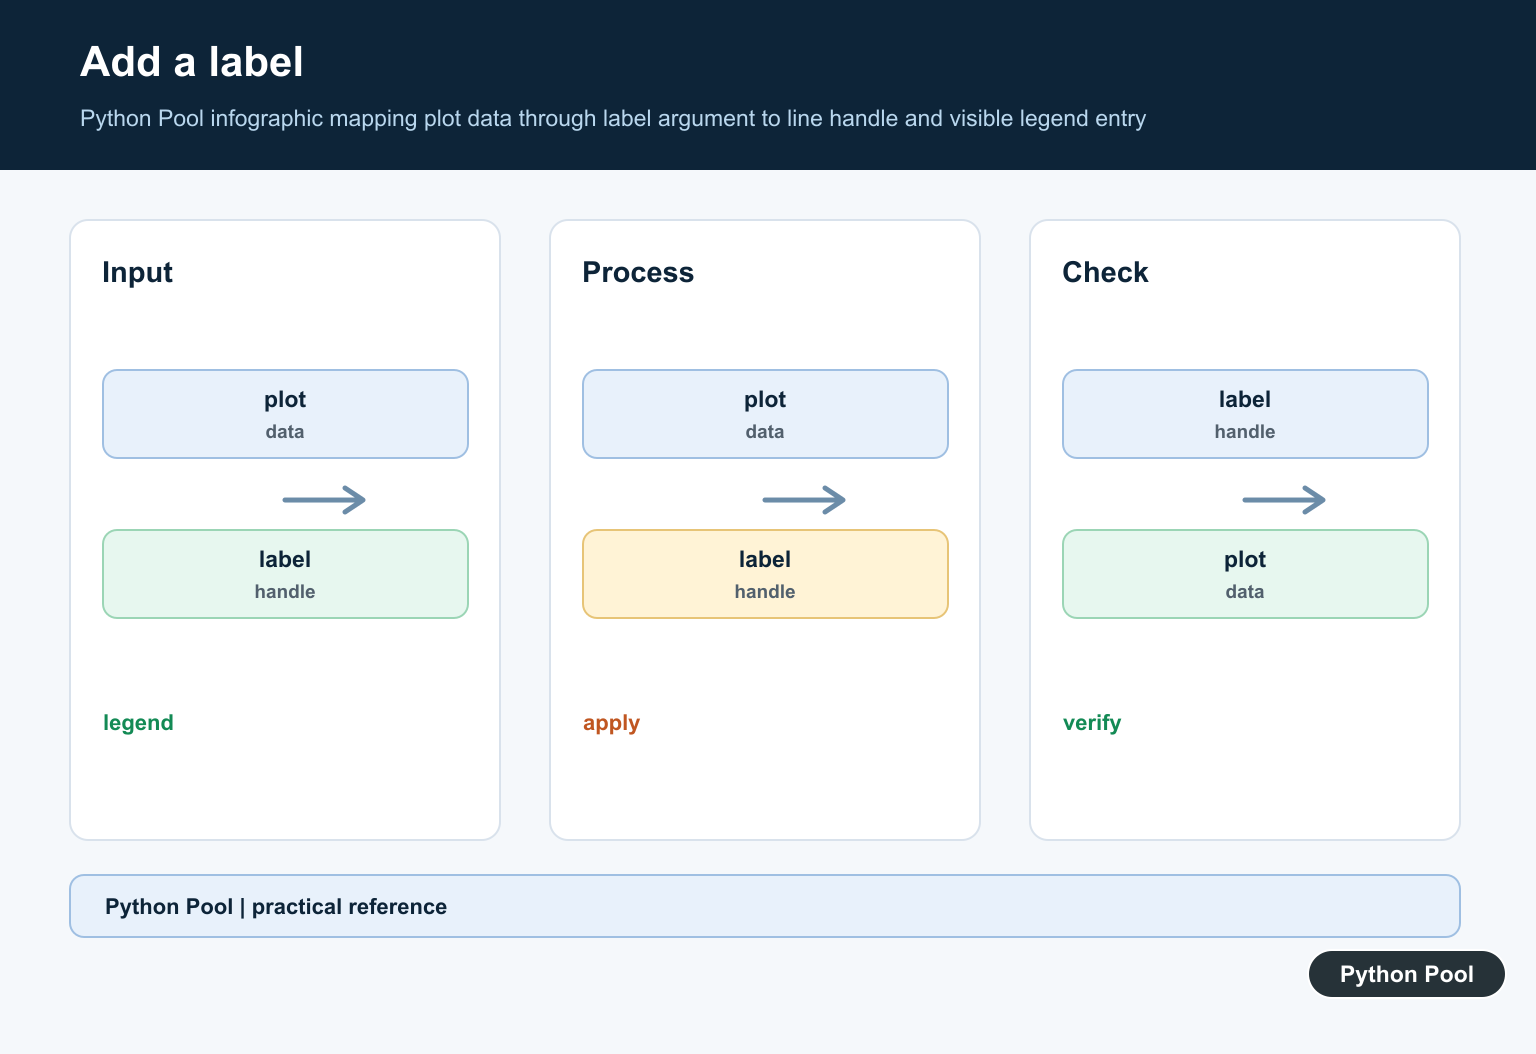
Add a label when plotting
The simplest fix is to provide a label at the point where the artist is created.
import matplotlib.pyplot as plt

figure, axis = plt.subplots()
axis.plot([1, 2, 3], [2, 4, 6], label="training")
axis.plot([1, 2, 3], [1, 3, 5], label="validation")
axis.legend()
Use labels that describe the plotted series rather than implementation details. In a loop, assign a label for each series that should appear and use a private label for helper artists that belong in the chart but not in the legend.
Label scatter and bar artists
The same rule applies to scatter plots and bar charts. Pass label to the plotting method or set it on the returned artist before calling legend().
import matplotlib.pyplot as plt

figure, axis = plt.subplots()
axis.scatter([1, 2, 3], [2, 4, 3], label="observations")
axis.bar([1, 2, 3], [1, 3, 2], alpha=0.4, label="baseline")
axis.legend()
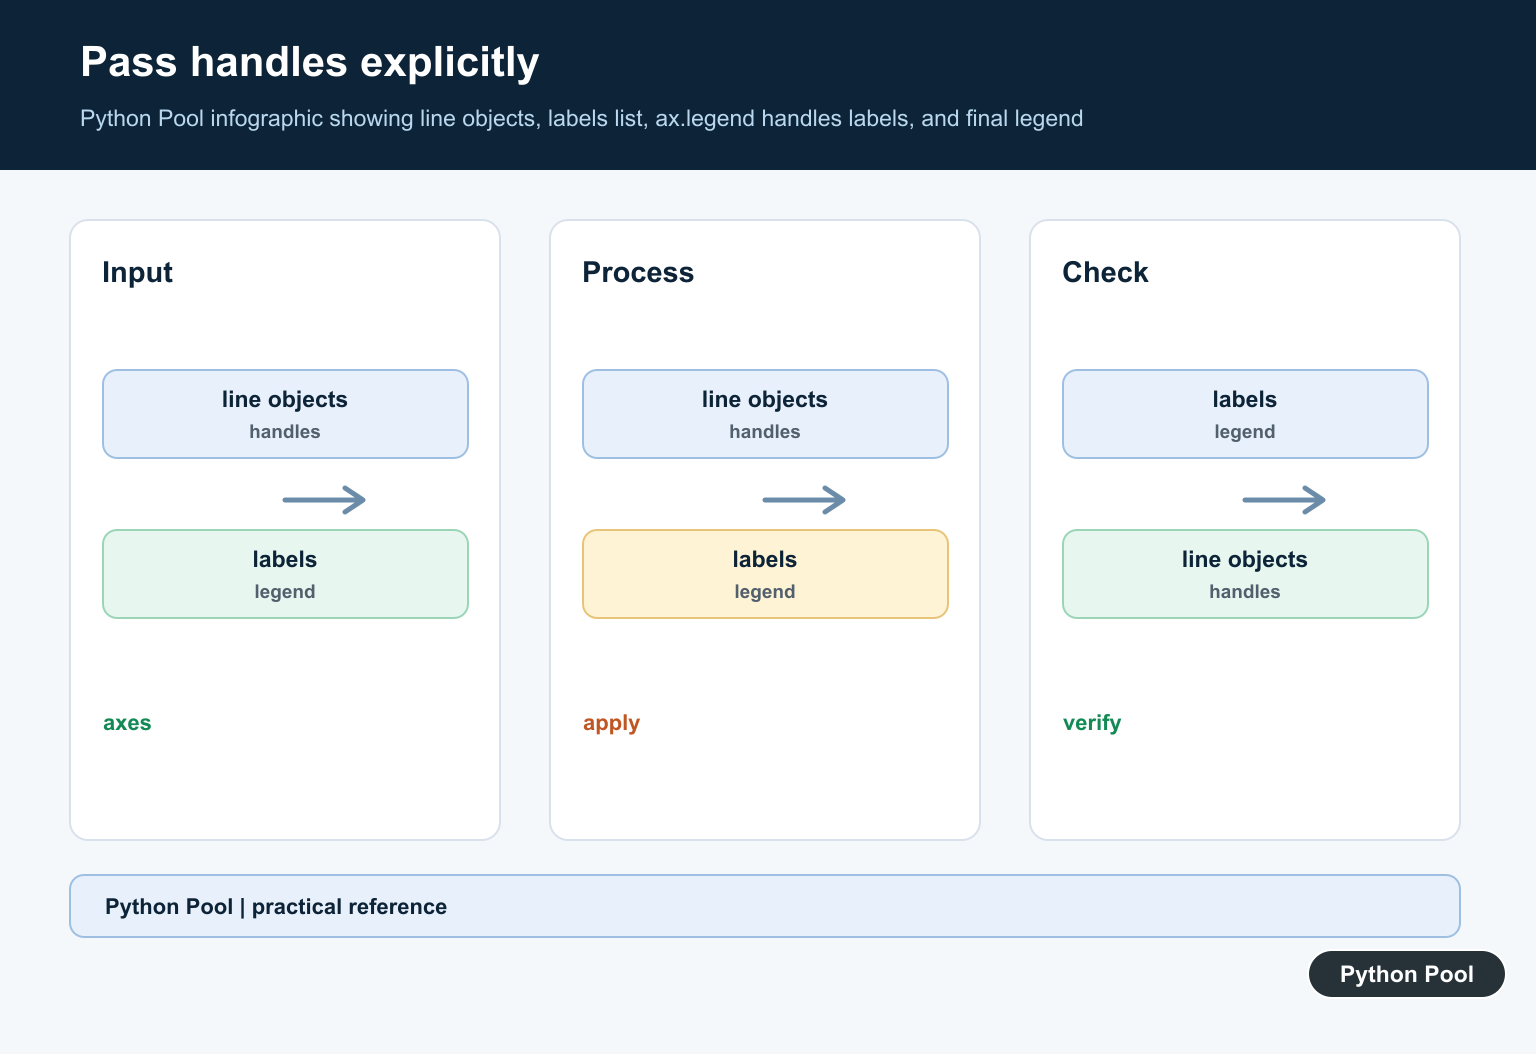
Inspect handles and labels
When automatic collection is surprising, inspect what Matplotlib sees. The get_legend_handles_labels() method returns the artists and public labels currently available on an axes.
handles, labels = axis.get_legend_handles_labels()
print(labels)
axis.legend(handles, labels)
Explicit handles are useful when labels must be reordered, renamed, or combined from different artists. They are also useful for a custom legend entry that is not directly generated by a plotting call.
Combine legends from two axes
With twin axes, each axes owns its own artists. Collect handles and labels from both axes before passing the combined lists to one legend.
handles_left, labels_left = axis.get_legend_handles_labels()
handles_right, labels_right = right_axis.get_legend_handles_labels()

axis.legend(
    handles_left + handles_right,
    labels_left + labels_right,
)
Remove duplicate labels before the final call when the same series is represented more than once. Keep the legend order aligned with the visual story of the chart.
Keep the fix focused
This warning is usually a setup problem rather than a rendering failure. Check the artist label, the call order, underscore-prefixed labels, and the axes object on which legend() is called. For related chart layout topics, see Matplotlib figsize and Matplotlib imshow().
Use the axes object consistently
Mixing the stateful pyplot API with multiple axes can send the legend call to a different axes than the one containing the labeled artist. The object-oriented form makes ownership explicit: create a figure and axes, call methods on that axes, and call axis.legend() on the same object.
import matplotlib.pyplot as plt

figure, axis = plt.subplots()
axis.plot([1, 2, 3], [2, 4, 6], label="series A")
axis.legend()
In a notebook, cells may also be run out of order. Re-run the plotting cell from top to bottom after changing labels, and clear an old figure when stale artists make the result confusing.
Label series inside a loop
When plotting several arrays in a loop, give each visible series a stable label. Do not call legend() on every iteration; create all artists first and build the legend once. This keeps the legend from being repeatedly rebuilt and makes duplicate entries less likely.
import matplotlib.pyplot as plt

figure, axis = plt.subplots()
series = {"train": [1, 3, 5], "test": [2, 2, 4]}

for name, values in series.items():
    axis.plot([1, 2, 3], values, label=name)

axis.legend()
If several helper artists represent one conceptual series, label only the representative artist and give the others a private label such as _nolegend_. That keeps the visual chart detailed without making the legend repetitive.
Create explicit custom entries
Sometimes the legend should describe a threshold, region, or category that is not a normal plotted line. Create a handle such as a Line2D object and pass it with the desired label. Explicit handles are also useful when the automatic order does not match the explanation in the surrounding text.
from matplotlib.lines import Line2D

threshold = Line2D([], [], color="red", linestyle="--", label="threshold")
axis.legend(handles=[threshold])
Keep custom handles synchronized with the chart’s colors, line styles, and marker choices. A legend is part of the data explanation, so a technically valid entry that does not match the plot can still mislead readers.
Deduplicate before finalizing
Repeated calls or repeated labels can create duplicate entries. Retrieve the handles and labels, preserve the first occurrence of each label, and pass the filtered lists explicitly when the plot contains many layers. Do not remove duplicates when the same label intentionally refers to separate visual encodings; document that choice instead.
After changing a label, inspect the rendered legend rather than checking only that the warning disappeared. Confirm that each entry maps to the correct color, marker, and line style, and that the legend remains readable at the final figure size. A silent legend with the wrong mapping is a data-communication bug even when Matplotlib reports no error.
Verify the final figure at the same size used in reports or exported files, because a legend that fits interactively can still collide with the axes when saved.
Include one visual regression check for the legend position and text when the chart is part of a generated report.
Frequently Asked Questions
Why does Matplotlib say no handles with labels were found?
legend() cannot find plotted artists with public labels, often because labels are missing, private, or created after the legend call.
How do I fix the Matplotlib legend warning?
Pass label to each plotted artist and call ax.legend() after the artists have been added to the axes.
How do I inspect Matplotlib legend handles?
Call ax.get_legend_handles_labels() to retrieve the artists and public labels currently available for automatic collection.
How do I combine legends from twin axes?
Collect handles and labels from both axes, concatenate the lists, and pass them explicitly to one legend call.