
Quick answer: Matplotlib subplot spacing is a layout problem, so choose the layout tool from the figure’s needs. Start with layout=’constrained’ for modern automatic placement, use fig.tight_layout() for a quick fit after adding labels, and use fig.subplots_adjust() or GridSpec when exact margins, gaps, spans, or unequal axes sizes matter. Check the saved output, not only the interactive window.
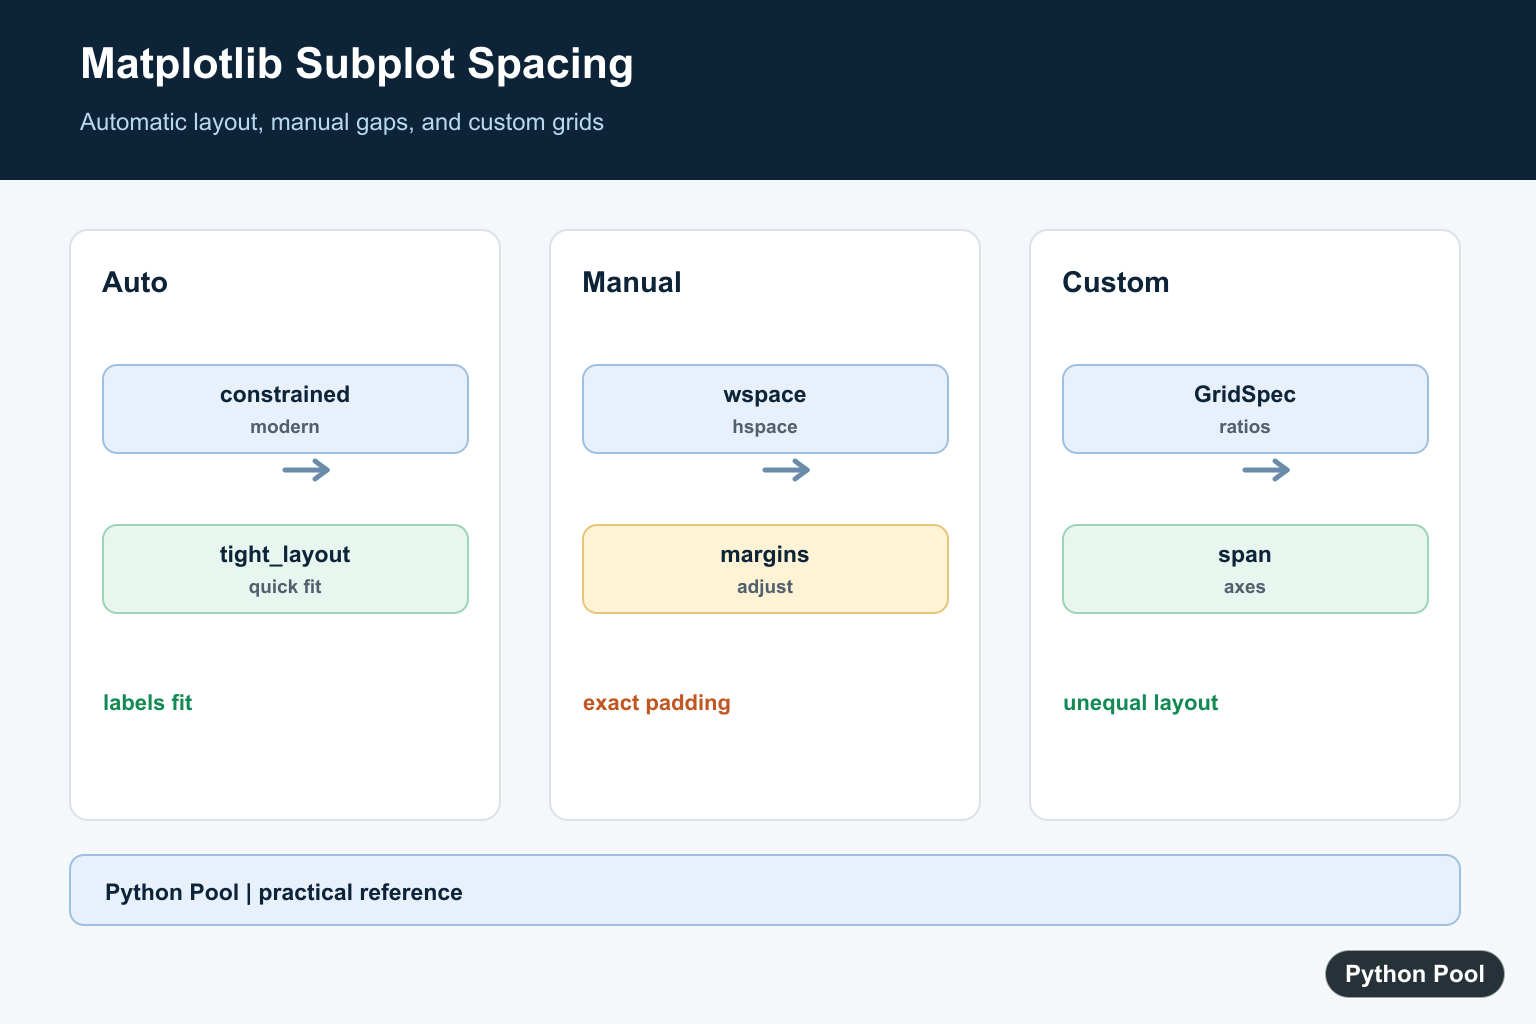
Matplotlib subplot spacing controls the empty space around and between axes in the same figure. It matters when titles, tick labels, legends, colorbars, or rotated labels overlap. The best fix depends on whether you want automatic layout, exact manual control, or an interactive adjustment tool.
For most modern plots, start with layout="constrained" or fig.tight_layout(). Use fig.subplots_adjust() when you need exact margins, row gaps, or column gaps. Use GridSpec when the axes themselves need different sizes. Use plt.subplot_tool() only when you are working interactively on a desktop backend.
Quick method comparison
| Method | Best for | Main controls |
|---|---|---|
fig.tight_layout() |
Automatic spacing after creating a figure | pad, w_pad, h_pad |
layout="constrained" |
Automatic spacing while Matplotlib builds the figure | Figure layout engine |
fig.subplots_adjust() |
Precise manual spacing | left, right, top, bottom, wspace, hspace |
GridSpec |
Uneven subplot sizes or custom grids | Grid rows, columns, ratios, and subplot spans |
Use tight_layout() for a fast automatic fix
tight_layout() adjusts subplot parameters so labels and titles fit inside the figure area. It is useful when a plot is almost correct but axis labels or titles are too close to each other.
import matplotlib.pyplot as plt

fig, axes = plt.subplots(2, 2)
for index, ax in enumerate(axes.flat, start=1):
    ax.plot([1, 2, 3], [index, index + 1, index + 2])
    ax.set_title(f"Plot {index}")
    ax.set_xlabel("X label")
    ax.set_ylabel("Y label")

fig.tight_layout(pad=1.2)
plt.show()
The pad value controls padding around the figure. w_pad and h_pad can control horizontal and vertical padding separately. If your main problem is clipped labels, also see the dedicated guide to Matplotlib tight_layout().
Use constrained layout for complex figures
Constrained layout is usually a better automatic option for figures with colorbars, legends, suptitles, or mixed axes. It works while Matplotlib lays out the figure, so it can solve spacing problems that appear after several artists are added.
import matplotlib.pyplot as plt

fig, axes = plt.subplots(2, 2, layout="constrained")
for index, ax in enumerate(axes.flat, start=1):
    ax.plot([1, 2, 3], [index, index + 1, index + 2])
    ax.set_title(f"Series {index}")

fig.suptitle("Constrained subplot layout")
plt.show()
Older code may use constrained_layout=True. For new examples, layout="constrained" is clear and matches current Matplotlib documentation. Avoid calling tight_layout() and constrained layout together on the same figure; pick one automatic layout system.
Use subplots_adjust() for exact spacing
When automatic layout is close but not exact, fig.subplots_adjust() gives direct control over the figure margins and gaps between subplots. The most common values are wspace for width spacing between columns and hspace for height spacing between rows.
import matplotlib.pyplot as plt

fig, axes = plt.subplots(2, 2)
for index, ax in enumerate(axes.flat, start=1):
    ax.plot([1, 2, 3], [index, index + 1, index + 2])
    ax.set_title(f"Plot {index}")

fig.subplots_adjust(
    left=0.08,
    right=0.98,
    bottom=0.08,
    top=0.92,
    wspace=0.35,
    hspace=0.45,
)
plt.show()
The margin values use figure-relative coordinates. For example, left=0.08 means the left edge of the subplot area starts 8 percent from the left side of the figure. Increase wspace when columns are too close, and increase hspace when rows overlap.
Use GridSpec for uneven subplot layouts
If the plots should not all have the same width or height, spacing alone is not enough. GridSpec lets you build a grid and place axes across rows or columns. This is useful for dashboards, side panels, or a large main plot with smaller supporting plots.
import matplotlib.pyplot as plt

fig = plt.figure(figsize=(8, 4), layout="constrained")
grid = fig.add_gridspec(2, 2, width_ratios=[2, 1])

main_ax = fig.add_subplot(grid[:, 0])
top_ax = fig.add_subplot(grid[0, 1])
bottom_ax = fig.add_subplot(grid[1, 1])

main_ax.plot([1, 2, 3], [2, 4, 3])
top_ax.plot([1, 2, 3], [3, 1, 2])
bottom_ax.plot([1, 2, 3], [1, 3, 2])

plt.show()
For deeper grid layouts, read the PythonPool guide to Matplotlib GridSpec. If your spacing issue is related to plot shape instead of labels, Matplotlib aspect ratio is the next setting to check.
Use subplot_tool() only for interactive adjustment
plt.subplot_tool() opens an interactive window for changing subplot margins and spacing. It is useful when you are exploring a figure locally, but it is not the best choice for notebooks, servers, CI jobs, or scripts that must run without a GUI.
import matplotlib.pyplot as plt

fig, axes = plt.subplots(2, 2)
plt.subplot_tool()
plt.show()
Once you find spacing values that work, copy those values into fig.subplots_adjust(). That makes the layout reproducible instead of depending on a manual GUI step.
Practical rules for subplot spacing
Use automatic layout first when you only need labels and titles to stop overlapping. Use subplots_adjust() when you need exact margins for publication, screenshots, or matching several figures. Use GridSpec when a subplot should span more space than another subplot. When tick labels are the real issue, adjust them directly with tools such as Matplotlib xticks and Matplotlib ylim.
For most 2 by 2 figures, this order works well: create the figure, add titles and labels, try layout="constrained", and then use fig.subplots_adjust(wspace=..., hspace=...) only if you still need finer control. If you are also showing grid lines, the Matplotlib grid guide covers the axis grid styling separately from subplot spacing.
Official Matplotlib references
- pyplot.subplots_adjust documentation
- Figure.subplots_adjust documentation
- Tight layout guide
- Constrained layout guide
- pyplot.subplot_tool documentation
- GridSpec API documentation
Start With Constrained Layout
Constrained layout is the modern automatic layout engine and can account for axes decorations while the figure is built. Set it when creating the figure, especially when colorbars or multiple labels need room.
import matplotlib.pyplot as plt

fig, axes = plt.subplots(2, 2, layout="constrained", figsize=(7, 5))
for index, ax in enumerate(axes.flat, start=1):
    ax.plot([1, 2, 3], [index, index + 1, index + 2])
    ax.set_title(f"Plot {index}")
    ax.set_xlabel("x label")
    ax.set_ylabel("y label")
Use tight_layout For A Quick Fit
tight_layout adjusts subplot parameters when it is called. Call it after adding titles, labels, and legends, and use pad, w_pad, or h_pad when the automatic result needs a little more breathing room.
import matplotlib.pyplot as plt

fig, axes = plt.subplots(1, 2, figsize=(7, 3))
for ax in axes:
    ax.plot([1, 2, 3], [2, 1, 3])
    ax.set_xlabel("long x label")
    ax.set_title("A subplot title")
fig.tight_layout(pad=1.2, w_pad=2.0)
Control Spacing Manually
subplots_adjust uses normalized figure coordinates and is useful when you know the exact outer margins or the gap between rows and columns. Manual settings can override the visual balance, so inspect at the target output size.
import matplotlib.pyplot as plt

fig, axes = plt.subplots(2, 2, figsize=(6, 5))
for ax in axes.flat:
    ax.imshow([[0, 1], [1, 0]])
    ax.set_xticks([])
    ax.set_yticks([])
fig.subplots_adjust(left=0.08, right=0.96, bottom=0.08, top=0.92, wspace=0.18, hspace=0.28)
Use GridSpec For Unequal Axes
GridSpec describes a grid where an axes can span rows or columns and where ratios can differ. It solves a geometry problem rather than merely adding whitespace, which makes it appropriate for dashboards and plots with a main panel plus supporting panels.
import matplotlib.pyplot as plt
from matplotlib.gridspec import GridSpec

fig = plt.figure(figsize=(7, 4), layout="constrained")
grid = GridSpec(2, 3, figure=fig, width_ratios=[2, 1, 1])
main = fig.add_subplot(grid[:, 0])
small_top = fig.add_subplot(grid[0, 1:])
small_bottom = fig.add_subplot(grid[1, 1:])
main.set_title("main")
small_top.set_title("top")
small_bottom.set_title("bottom")
Matplotlib documents Figure.tight_layout() and the more modern layout engines. The tight-layout guide explains padding and limitations. Related references include tight_layout, GridSpec, and aspect ratio.
For related figure layout decisions, compare tight layout, GridSpec, and aspect ratio when arranging multiple axes.
Frequently Asked Questions
How do I fix Matplotlib subplot spacing?
Try layout=’constrained’ when creating the figure or call fig.tight_layout() after adding labels; use subplots_adjust for exact manual margins.
What is better, tight_layout or constrained layout?
Constrained layout is the more modern automatic layout engine, while tight_layout remains useful for a quick compatible adjustment.
How do I control horizontal and vertical gaps?
Use wspace and hspace with subplots_adjust or the relevant layout engine settings.
When should I use GridSpec?
Use GridSpec when subplot sizes, spans, or ratios need a custom grid rather than only more padding.