Hello geeks and welcome to today’s article, we will cover Matplotlib Colorbar. Along with that, for an overall better understanding, we will also look at its syntax and parameter. Then we will see the application of all the theory parts through a couple of examples. But before moving ahead, let us try to get a general overview of what Colorbar actually does.
Matplotlib Colorbar is a visualization of the mapping of scalar values to colors. This way your data can be shown in a way to make it understandable to general audiences. As we move ahead, things will become a lot clearer to us. We will be looking at the syntax associated with this function, followed by parameters.
Syntax
matplotlib.pyplot.colorbar()
This is the general syntax associated with our function. It has few parameters associated with it that we will be covering in the next section.
Parameters
1. ax:
This is an optional parameter. It represents the Axes or the list of Axes.
2. extend:
This parameter helps in making a pointed range for out-of-the-range values in the plot.
3. Label:
This parameter helps us annotate or label the Colorbar. This ultimately tells us about what Colorbar actually represents.
4. Ticks
This helps us in producing custom labels for the Colorbar.
Return
On completion of the Program, it returns a Colorbar as requested by the user.
Examples
As if now we have covered all the theories associated with the Matplotlib Colorbar. In this section, we will be looking at how this function works and how it helps us achieve our desired output. We will start with an elementary-level example and gradually move our way to more complicated examples.
1. Vertical Colorbar()
import matplotlib.pyplot as plt
Numberofvisit = [1005, 890, 755, 2300, 3000, 1050,1560]
sales = [150, 70, 55, 180, 270, 134, 86]
conversion = [.14,.07,.07,.08,.09,.13,.08]
plt.scatter(x=Numberofvisit,y=sales,c=conversion,cmap="autumn")
cbar=plt.colorbar(label="conversion", orientation="vertical",shrink=.75)
cbar.set_ticks([0.07,.07, 0.08, 0.09, 0.13,.14])
cbar.set_ticklabels(["A","A", "B", "C", "D","E"])
plt.show()

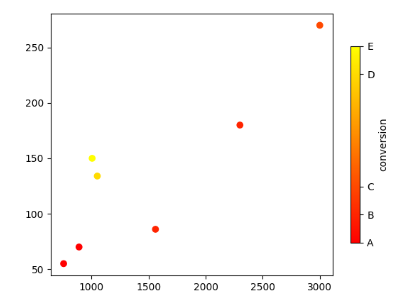
Above we can see a simple example related to vertical Colorbar. Here the scatterplot is of an e-commerce website. It represents the Number of visitors VS the number of sales made. Here the Colorbar represents the ratio between the 2. From the Colorbar we can get the data that even though the number of visitors was less on certain days the sales were higher. The yellow spots represent higher conversion rates.
Now coming to the code for this program. Here at first, we imported the matplotlib module of Python. Then we have specified Points for the X and Y coordinates. Following this, we have specified the conversion ratio. Then we have plotted it here. We have used a term called cmap, which means Colormap. The cmap generates color corresponding to the specified condition. For this particular case, we have used “Autumn.”
For the Colorbar tag, we have used the label tag, which specifies what it represents and its orientation. Using the label tag, we have given the label ‘CONVERSION’ to our colorbar. To customize the size of the colorbar, we have used the ‘shrink‘ function. Here we have also added the ticks on the colorbar. To do so, we have used the ‘set ticks’ and ‘set ticklabels’ functions.
2. ColorBar for multiple plots
import matplotlib.pyplot as plt
import numpy as np

fig, plots = plt.subplots(nrows=2, ncols=2)

for graphs in plots.flat:
    im = graphs.imshow(np.random.random((4, 2)), vmin=0, vmax=1)

plt.colorbar(im, ax=plots.ravel().tolist())

plt.show()

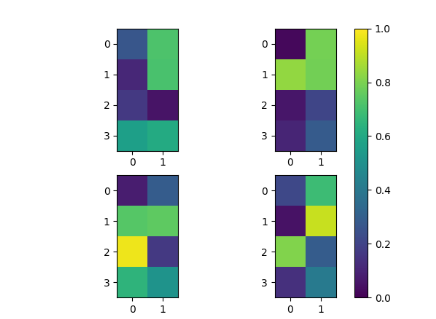
Here we can see an example related to Colorbar for multiple plots. Now let us go line by line and understand how we can achieve it. To execute it, we require a NumPy module along with the Matplotlib. Now here we wish to have 4 different subplots. Likewise, if we wish to 6 plots, we can use 2,3 and 3,2. After which, we have used the imshow function of the Matplotlib. You can also read about the imshow function of Cv2. The Imshow function helps in printing out a 2-d image as output.
Inside Imshow, we have the random.random function of NumPy. What it does is that it returns multiple float values between the open inetrwal[0.0,1.0). To repeat it multiple times, we have used it inside a “for loop,” Here, to set the range of “colorbar,” we have used Vmin and Vmax. You can adjust it according to your need. This shows the range of your colorbar. Then we have used the Colorbar and show function.
How to set the font size of Matplotlib Colorbar labels?
Labels are the text which appears on your graph along the axis. Surprisingly, you can easily edit them and customize them according to your need. Moreover, you can set the size of the font, the weight of the font, and font family. The following example will help you to understand –
import numpy as np
import matplotlib.pyplot as plt

x = [101, 202, 151, 26, 33, 53, 186]

y = [52, 71, 101, 12, 11, 35, 57]

weight = [1, 0.56, 2.01, 0.77, 0.51, 2.185, 0.86]

plt.scatter(x=x, y=y, c=weight, cmap="summer")
plt.colorbar(orientation="horizontal").set_label(label='new label',size=15,weight='bold')
plt.show()
Output:

Explanation:
set_label() function can be used to set the size and weight of the fonts. This option is available in all the labels of matplotlib graphs.
Conclusion
In this article, we covered the Matplotlib Colorbar. Besides that, we have also looked at its syntax and parameters. For better understanding, we looked at a couple of examples. We varied the syntax and looked at the output for each case. In the end, we can conclude that function Matplotlib Colorbar is used to generate Colourbars, which is a visual representation of scalar values.
I hope this article was able to clear all doubts. But in case you have any unsolved queries feel free to write them below in the comment section. Done reading this, why not read about different methods to normalize an array.
