
Quick answer: np.logspace creates samples that are evenly spaced in exponent space. With the default base of 10, logspace(1, 3, num=3) returns 10, 100, and 1000. Use linspace for equal arithmetic differences, choose base explicitly when needed, and control endpoint and sample count so plots and numerical experiments have the intended range.
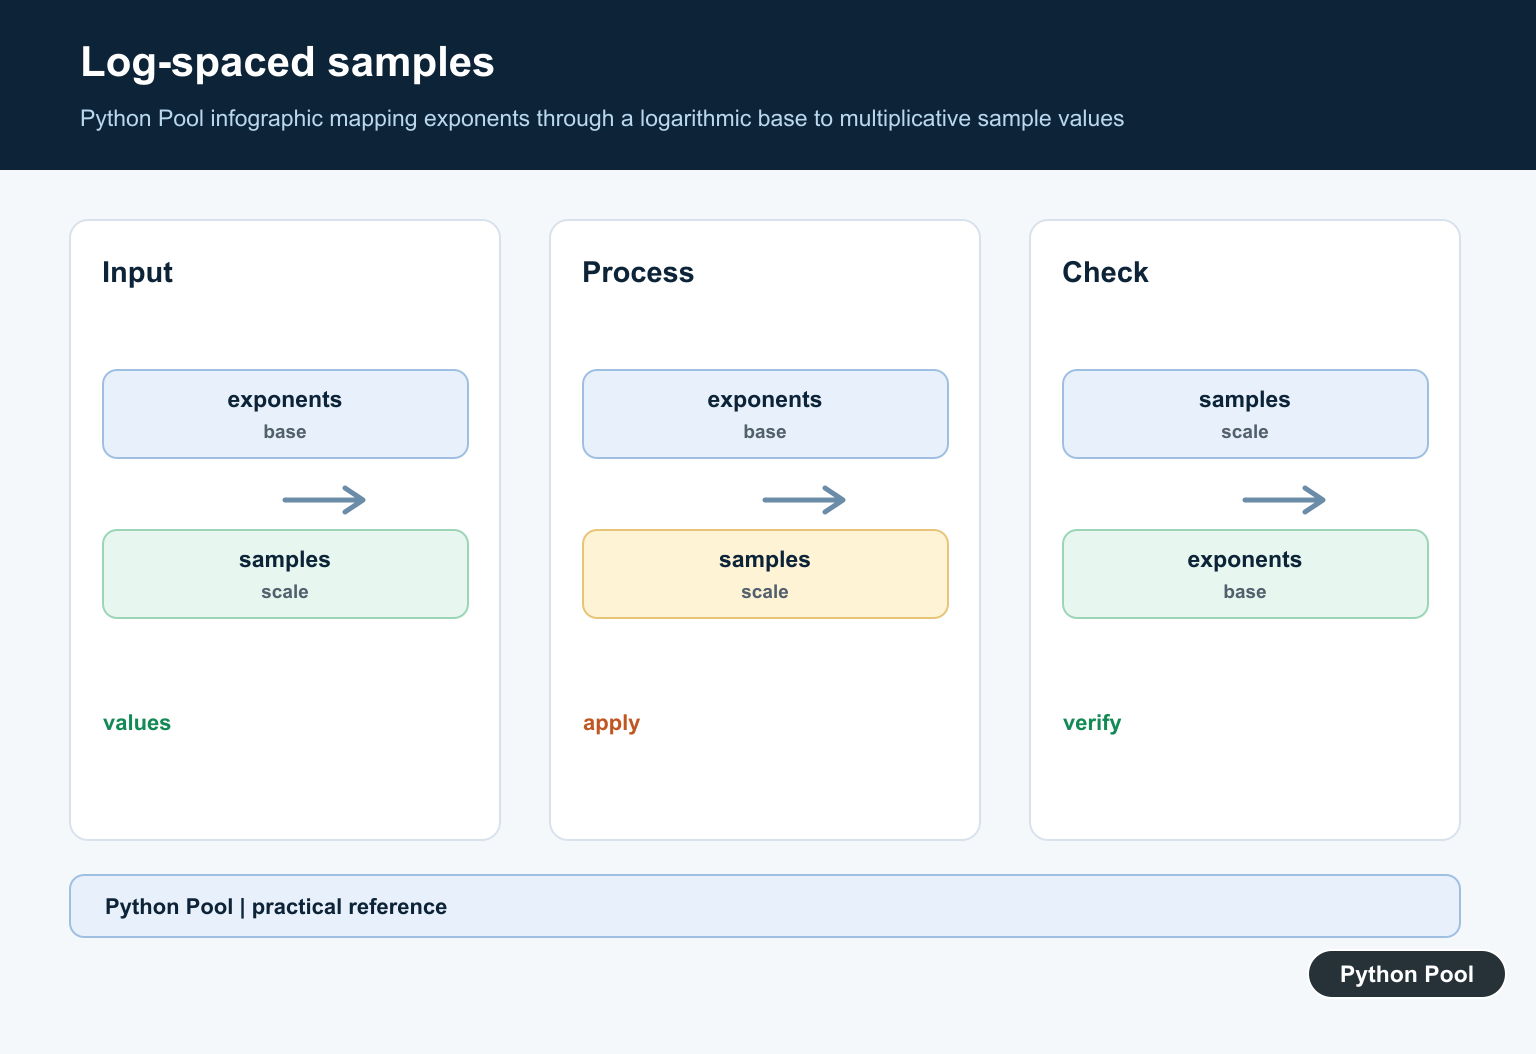
numpy.logspace() creates numbers that are evenly spaced on a logarithmic scale. Instead of spacing the final values evenly, it spaces the exponents evenly.
The official NumPy documentation covers numpy.logspace(), numpy.linspace(), and numpy.geomspace().
Use logspace() when values should grow by powers, such as frequency ranges, regularization strengths, chart scales, and scientific data that spans several orders of magnitude.
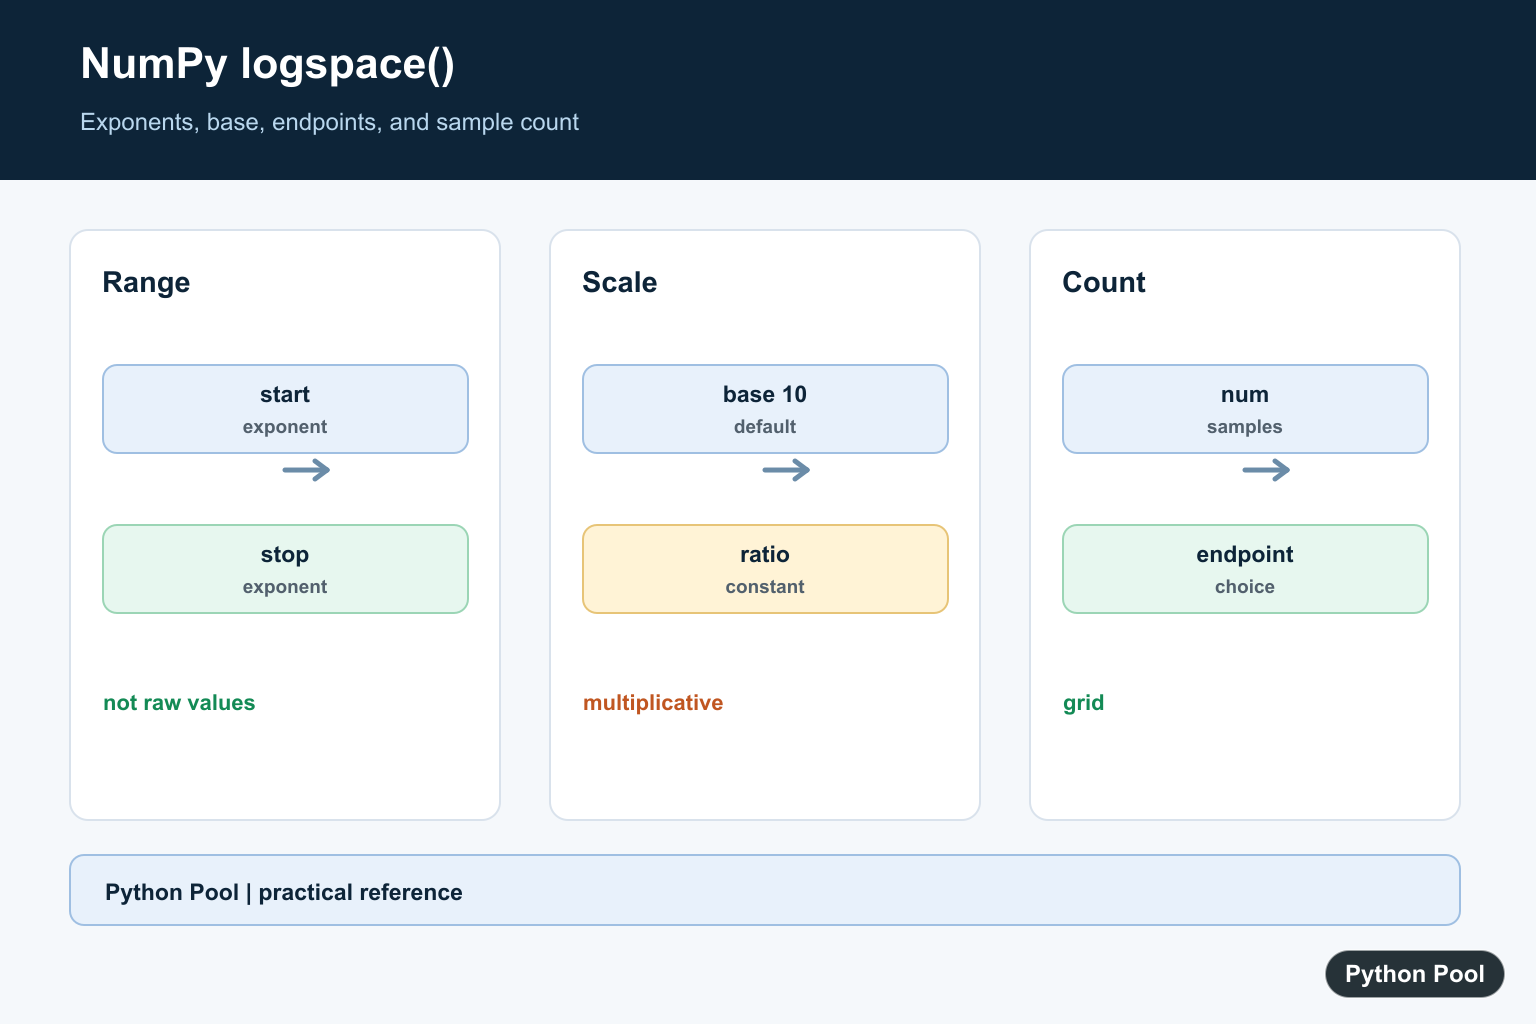
The key idea is that start and stop are exponents. With the default base 10, start=0 means 10 ** 0, and stop=3 means 10 ** 3.
The most common options are num, base, endpoint, dtype, and axis.
Log-spaced ranges are helpful when small and large values should both be represented. A linear range from 1 to 1000 can skip too quickly past the small end, while a log-spaced range keeps each order of magnitude visible.
Before using logspace(), decide which exponents should be included. That is usually easier than guessing final values directly, especially for powers of ten or powers of two.
Create Basic Log-Spaced Values
Use np.logspace(start, stop, num) to create values over powers of ten.
import numpy as np

values = np.logspace(0, 3, num=4)

print(values)
This creates 1, 10, 100, and 1000.
The exponents are evenly spaced from 0 through 3.
Use this form when you need a simple sequence across powers of ten.
This pattern is common for plot ticks, synthetic test data, and search grids where the values should increase multiplicatively.
Change The Base
The base argument controls which power base is used.
import numpy as np

values = np.logspace(0, 4, num=5, base=2)

print(values)
This creates powers of two from 2 ** 0 through 2 ** 4.
Changing the base is useful for binary scales, growth factors, or domain-specific ranges.
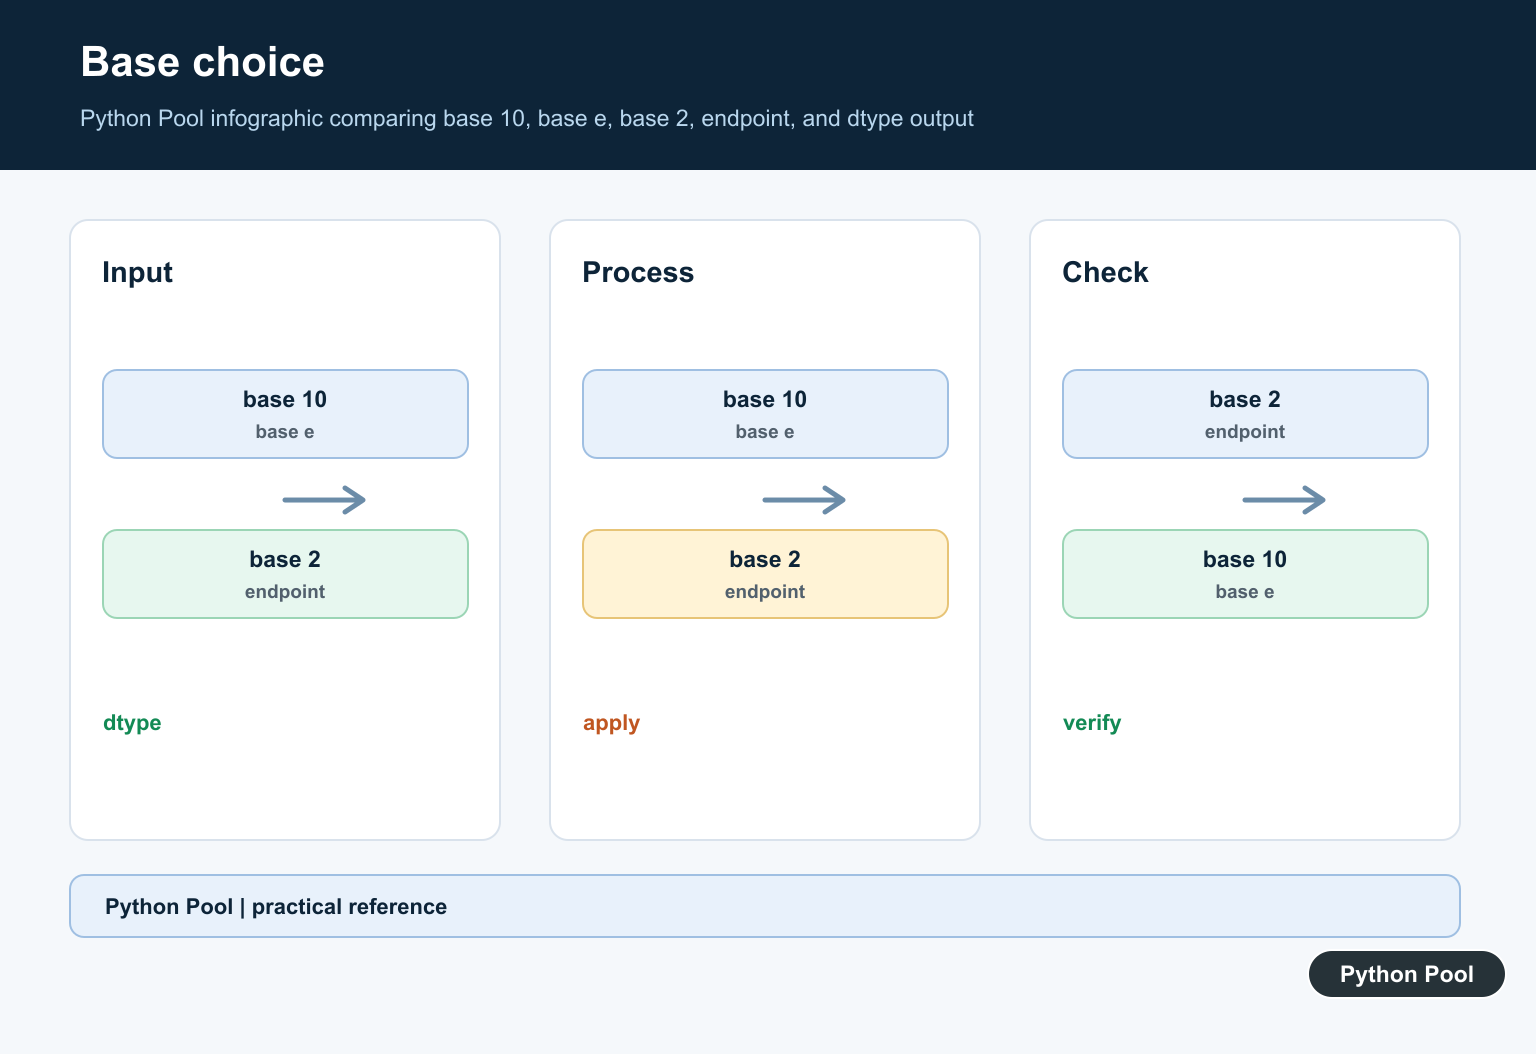
Keep the base clear in reports because the same start and stop exponents produce different final values with a different base.
For example, base ten is natural for decimal orders of magnitude, while base two can be easier to read for sizes, binary growth, or doubling experiments.

Exclude The Endpoint
Set endpoint=False when the stop exponent should not be included.
import numpy as np

values = np.logspace(0, 3, num=4, endpoint=False)

print(values)
The sequence still has four values, but it stops before the final exponent.
This is useful when creating adjacent bins or repeated ranges where the end of one range is the start of the next.
Use the default endpoint=True when the final endpoint should appear in the output.
Set dtype
The dtype argument controls the output type.
import numpy as np

values = np.logspace(0, 2, num=3, dtype=np.float64)

print(values)
print(values.dtype)
Log-spaced values are usually floating-point numbers because many ranges contain non-integer results.
Set dtype when precision or memory use matters. For simple exploration, the default dtype is usually fine.
Use care with integer dtype because rounding can remove important scale information.
Compare logspace And linspace
linspace() spaces final values evenly. logspace() spaces exponents evenly.
import numpy as np

linear = np.linspace(1, 1000, num=4)
log_scaled = np.logspace(0, 3, num=4)

print(linear)
print(log_scaled)
The two arrays cover a similar range, but the spacing is very different.
Use linspace() for linear scales and logspace() for multiplicative scales.
This distinction matters for plots, search grids, and numeric experiments.
If the data will be shown on a log-scaled chart, generating test points with logspace() often creates a more balanced visual distribution than generating them with linspace().
Use geomspace() when you want to specify the final starting and ending values directly. Use logspace() when thinking in exponents is clearer.
That distinction keeps range setup readable.
Use Multiple Start And Stop Values
logspace() can create more than one sequence when start and stop are arrays.
import numpy as np

values = np.logspace([0, 1], [2, 3], num=3, axis=0)

print(values)
print(values.shape)
This creates paired log-spaced sequences and keeps the output shape controlled by axis.
This form is useful when several ranges should be generated together.
Check the shape after creation so later calculations receive the layout they expect.
When several ranges are generated together, keep the axis choice close to the call. That makes the output easier to review before it is passed into plotting or simulation code.
Common logspace Mistakes
The first common mistake is treating start and stop as final values. They are exponents, not the final endpoints themselves.
The second mistake is using logspace() when a linear range is needed. Use linspace() for evenly spaced final values.
The third mistake is forgetting the base. The default is base ten, but other bases can change the output substantially.
In short, use np.logspace(start, stop, num) for logarithmic ranges, set base when powers of ten are not desired, and choose endpoint based on whether the final exponent should be included.
Choose Exponents
The start and stop arguments are exponents, not the final values. Write the resulting endpoints when reviewing code so a base-10 assumption is not confused with a direct numeric range.
import numpy as np

values = np.logspace(1, 3, num=5)
print(values)
print(values[0], values[-1])
Compare linspace And logspace
linspace keeps additive differences constant, while logspace keeps multiplicative ratios constant. Choose based on whether the domain is linear or spans orders of magnitude.
import numpy as np

print(np.linspace(1, 1000, num=4))
print(np.logspace(0, 3, num=4))

Use Another Base
Pass base when the scale is binary, natural-log based, or otherwise not powers of ten. The exponents stay in the same conceptual space while the output values change with the base.
import numpy as np

print(np.logspace(0, 4, num=5, base=2))
Control The Endpoint
endpoint=False omits the final exponent and is useful when constructing repeated sample intervals. Verify the count and final value before using the array as a frequency or parameter grid.
import numpy as np

values = np.logspace(0, 3, num=4, endpoint=False)
print(values)
print(len(values))
NumPy’s logspace() reference defines exponent spacing, base, endpoint, and count. Related references include natural and base logs, polynomial evaluation, and arithmetic ranges.
For related numerical grids, compare logarithms, polynomial evaluation, and arithmetic ranges when selecting a scale.
Frequently Asked Questions
What does np.logspace do?
It returns numbers spaced evenly on a logarithmic scale between base**start and base**stop.
How is logspace different from linspace?
linspace uses equal arithmetic differences, while logspace uses equal differences between exponents.
What does base mean?
base selects the logarithm base used to turn the start and stop exponents into values.
How do I exclude the stop value?
Pass endpoint=False when the final exponent should not be included.