
Quick answer: NumPy normal sampling uses a mean called loc, a non-negative standard deviation called scale, and an optional size for output shape. New code should prefer rng = np.random.default_rng(seed) followed by rng.normal(...).
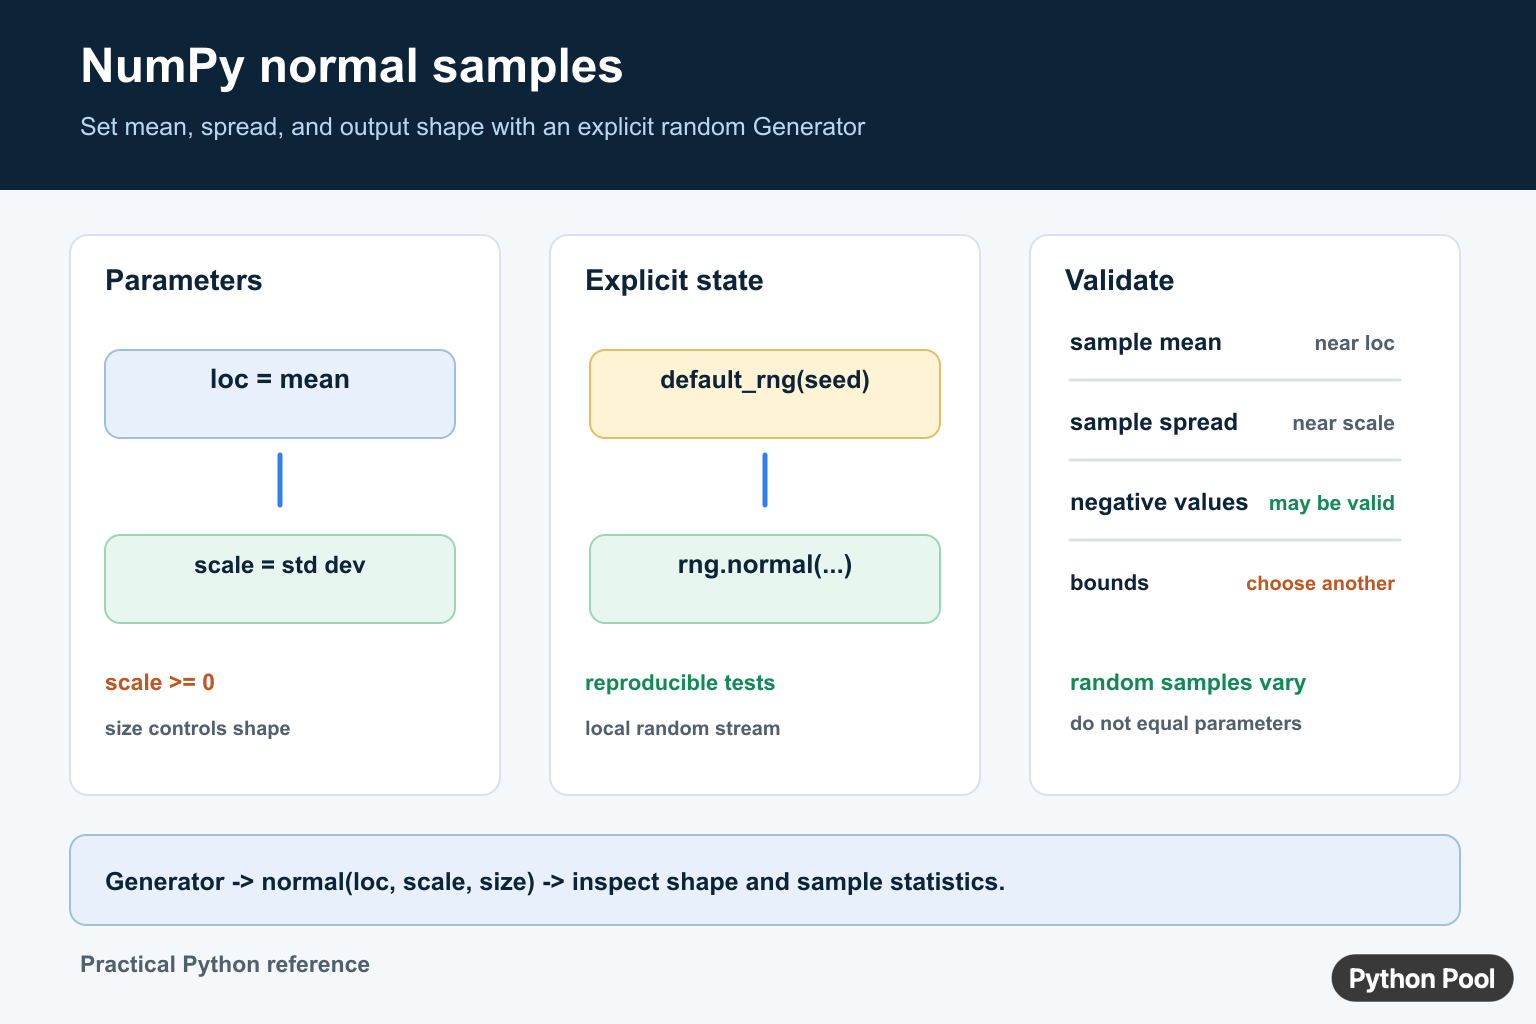
numpy.random.normal() generates samples from a normal distribution. In newer NumPy code, the recommended style is to create a random generator with np.random.default_rng() and then call rng.normal(). This keeps random state explicit and reproducible.
The official NumPy documentation for Generator.normal(), default_rng(), and the legacy numpy.random.normal() call explains the parameters.
The three main parameters are loc, scale, and size. loc is the center of the distribution. scale is the standard deviation and must be nonnegative. size controls how many samples NumPy returns and what shape the output has.
Use normally distributed samples for simulations, test data, noise, model examples, and teaching statistics. Do not use them as real measurements unless the normal-distribution assumption matches the domain.
Random generation also needs a reproducibility decision. For examples and tests, create a generator with a fixed seed. For production simulations, record the seed or random setup when results must be reviewed later.
Do not confuse a random sample with the exact distribution. A small sample can have a mean far from loc or a spread far from scale. Larger samples usually look closer, but they still vary from run to run unless the generator state is fixed.
Generate Basic Normal Samples
Create a generator, call normal(), and pass size for the number of samples.
try:
    import numpy as np
except ModuleNotFoundError:
    print("Install numpy to run this example.")
else:
    rng = np.random.default_rng(42)
    samples = rng.normal(size=5)

    print(samples.shape)
    print(round(float(samples.mean()), 3))
The result is a one-dimensional NumPy array with five floating-point samples.
The exact values are determined by the seed. Reusing the same seed is useful in tutorials, tests, and debugging because the sample sequence repeats.
When teaching or documenting code, print shapes and rounded summaries instead of depending on long arrays of exact floating-point values.
Set Mean And Standard Deviation
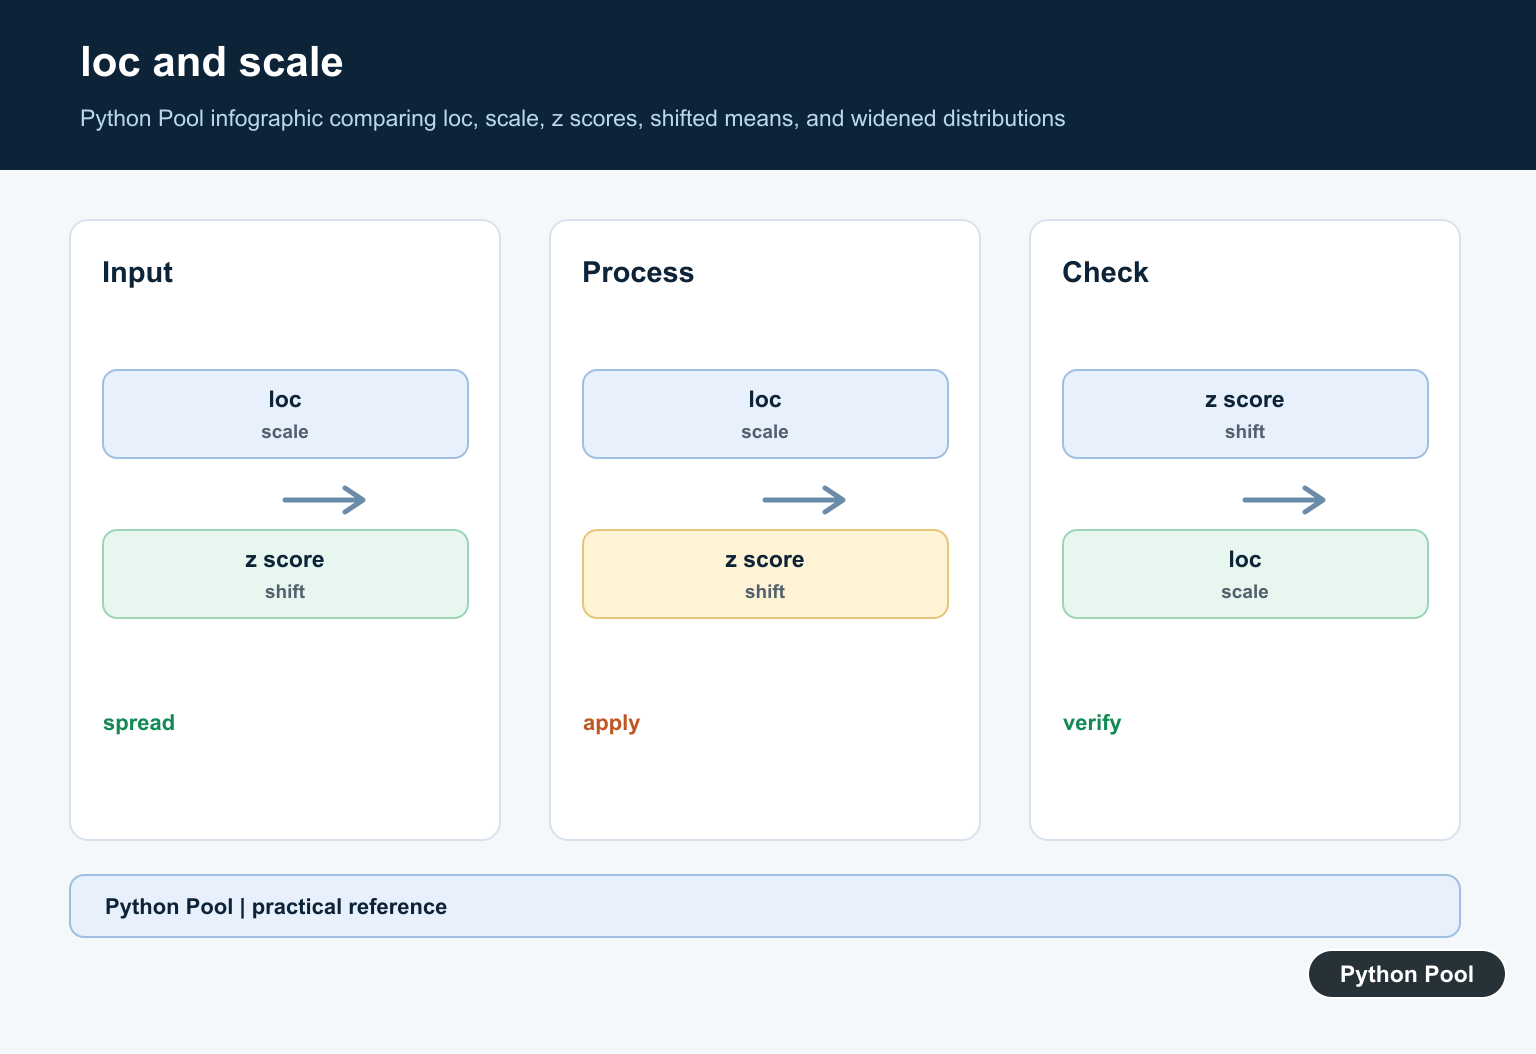
Use loc to shift the center and scale to control spread.
try:
    import numpy as np
except ModuleNotFoundError:
    print("Install numpy to run this example.")
else:
    rng = np.random.default_rng(7)
    heights = rng.normal(loc=170, scale=8, size=6)

    print(np.round(heights, 1))
    print(round(float(heights.mean()), 1))
Here the samples are centered around 170 with a standard deviation of 8. Small samples may not have exactly that mean, but larger samples usually move closer to the chosen parameters.
Keep scale positive for a useful distribution. A scale of zero returns values equal to loc, which is rarely a true random simulation.
Use domain units for both parameters. If loc is measured in centimeters, scale should be in centimeters too.

Create A Matrix Of Samples
The size argument can be a tuple. That returns an array with the requested shape.
try:
    import numpy as np
except ModuleNotFoundError:
    print("Install numpy to run this example.")
else:
    rng = np.random.default_rng(11)
    data = rng.normal(loc=0, scale=1, size=(2, 3))

    print(data.shape)
    print(np.round(data, 2))
This is useful for sample tables, simulation batches, synthetic features, and arrays that need to match an expected model input shape.
Check the shape before passing generated data to plotting or modeling code. A transposed or flattened array can make later results confusing.
If another array already has the target shape, pass that array’s shape attribute to generate matching noise or synthetic data.
Compare Sample Mean And Spread
For a larger sample, the observed mean and standard deviation should be close to the chosen parameters, but not exactly equal.
try:
    import numpy as np
except ModuleNotFoundError:
    print("Install numpy to run this example.")
else:
    rng = np.random.default_rng(21)
    values = rng.normal(loc=10, scale=2, size=1000)

    print(round(float(values.mean()), 1))
    print(round(float(values.std()), 1))
Random samples vary. The point is not to force exact numbers, but to check that the generated data is centered and spread roughly as expected.
For tests, avoid depending on one exact sample mean unless the seed and NumPy version are part of the contract. Shape and broad bounds are often better assertions.
For statistical checks, compare broad expectations over many samples rather than asserting a single generated value from a small sample.
Add Normal Noise
Normal samples are often used as noise added to a baseline signal.
try:
    import numpy as np
except ModuleNotFoundError:
    print("Install numpy to run this example.")
else:
    rng = np.random.default_rng(5)
    signal = np.array([10, 20, 30, 40], dtype=float)
    noise = rng.normal(loc=0, scale=0.5, size=signal.shape)
    noisy_signal = signal + noise

    print(np.round(noisy_signal, 2))
Using signal.shape keeps the noise array aligned with the signal array.
This pattern appears in simulations, sensor examples, optimization demos, and model testing. Choose the noise scale based on the units of the signal.
Keep the original signal and generated noise separate while debugging. That makes it easier to see whether unexpected output came from the source data or the random perturbation.

Plot A Normal Histogram
A histogram can show whether generated samples have the expected bell-shaped pattern.
try:
    import numpy as np
    import matplotlib.pyplot as plt
except ModuleNotFoundError:
    print("Install numpy and matplotlib to run this example.")
else:
    rng = np.random.default_rng(99)
    samples = rng.normal(loc=0, scale=1, size=1000)

    fig, ax = plt.subplots()
    ax.hist(samples, bins=30)
    ax.set_title("Normal samples")
    plt.close(fig)

    print(samples.shape)
The plot helps inspect the distribution visually. For automated checks, use numeric summaries such as shape, mean, standard deviation, and bounds rather than judging a chart by eye.
In short, use default_rng() for reproducible random generation, set loc and scale deliberately, pass size for shape, and remember that random samples approximate a distribution rather than matching its parameters exactly. Normal samples model continuous variation, whereas NumPy Random Poisson: Generate Poisson Samples in Python generates nonnegative event counts from a Poisson rate parameter.
Read loc, scale, and size correctly
loc is the distribution mean and scale is the standard deviation, not the variance. scale must be non-negative. A scalar size creates a one-dimensional output, while a tuple such as (rows, columns) creates a matrix.
import numpy as np

rng = np.random.default_rng(7)
grid = rng.normal(loc=3.0, scale=0.5, size=(2, 4))
print(grid.shape)
Do not expect sample statistics to equal parameters
A finite sample will not have exactly the requested mean and standard deviation. Compare its statistics with a tolerance, increase sample size when estimating the distribution, and distinguish sample standard deviation from population standard deviation. See NumPy standard deviation for the ddof choice.
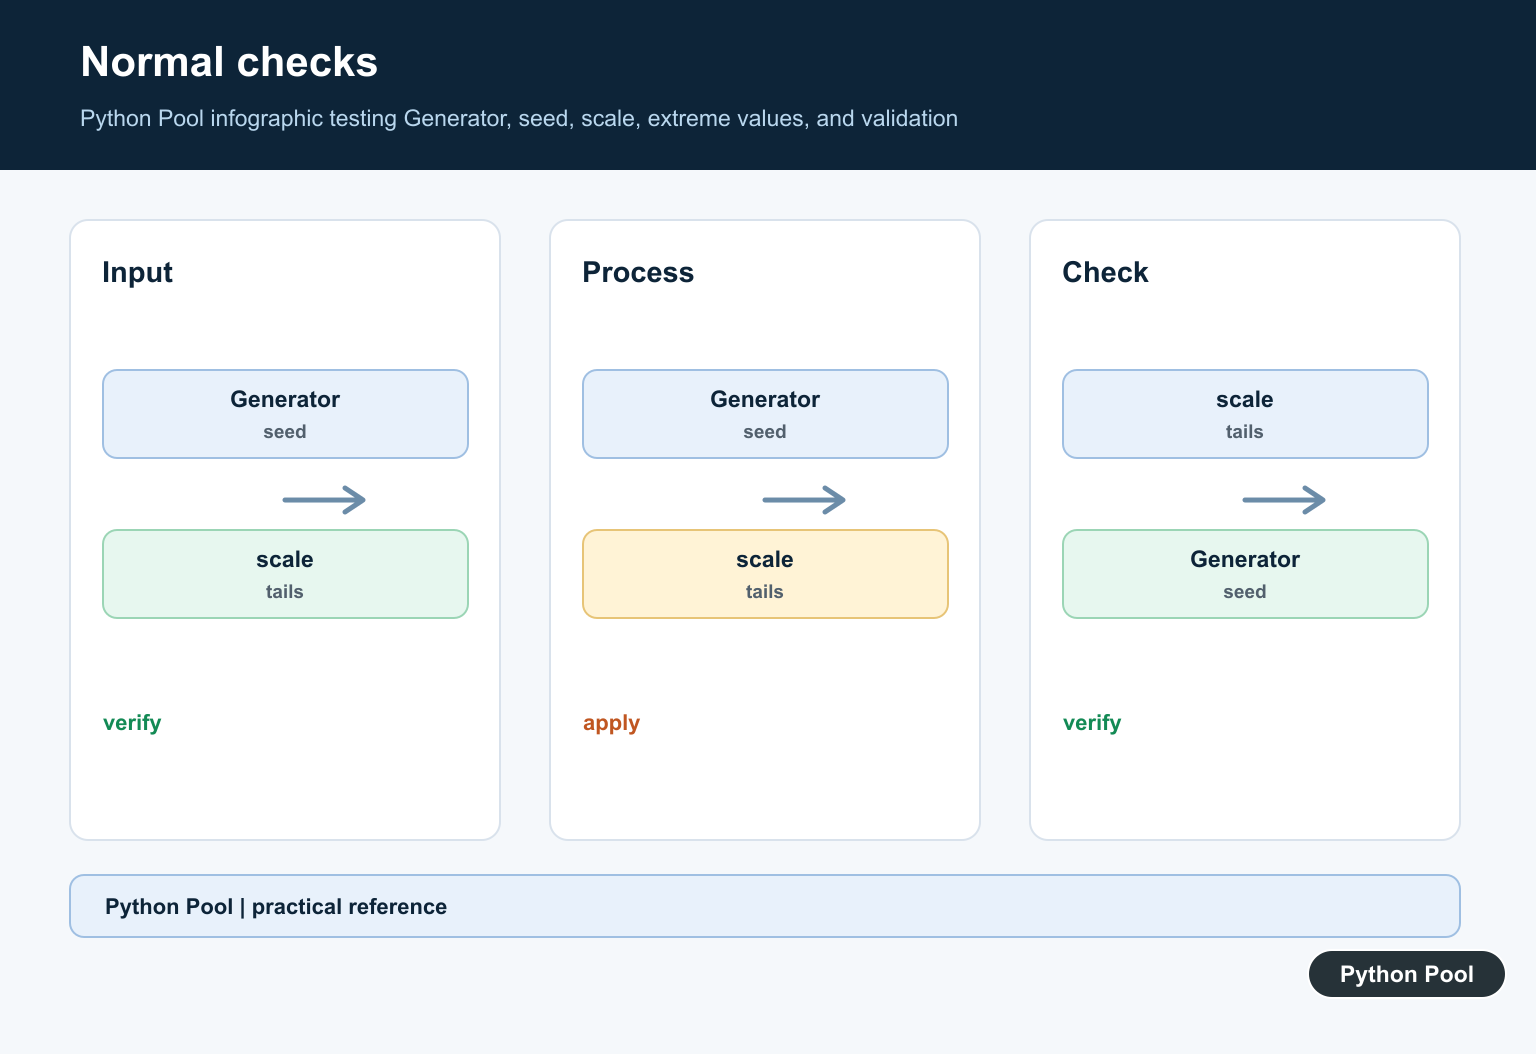
Know when normal is the wrong model
Normal samples can be negative and are not automatically appropriate for counts, probabilities, strictly positive measurements, or bounded values. Choose a distribution that matches the data-generating process rather than clipping a normal sample after the fact.
Frequently Asked Questions
What do loc and scale mean in NumPy normal()?
loc is the distribution mean and scale is its standard deviation; scale must be non-negative.
How do I choose the output shape?
Pass size as an integer or tuple to control the number and shape of samples returned by the Generator’s normal() method.
Why do sample values not equal loc and scale exactly?
loc and scale describe the population distribution; a finite random sample has statistics that vary around those parameters.
Why use default_rng() instead of the legacy global random functions?
default_rng() creates an explicit Generator whose state can be passed, seeded, and tested without relying on shared global random state.