Python locals(): Inspect Local Names and Scope Carefully
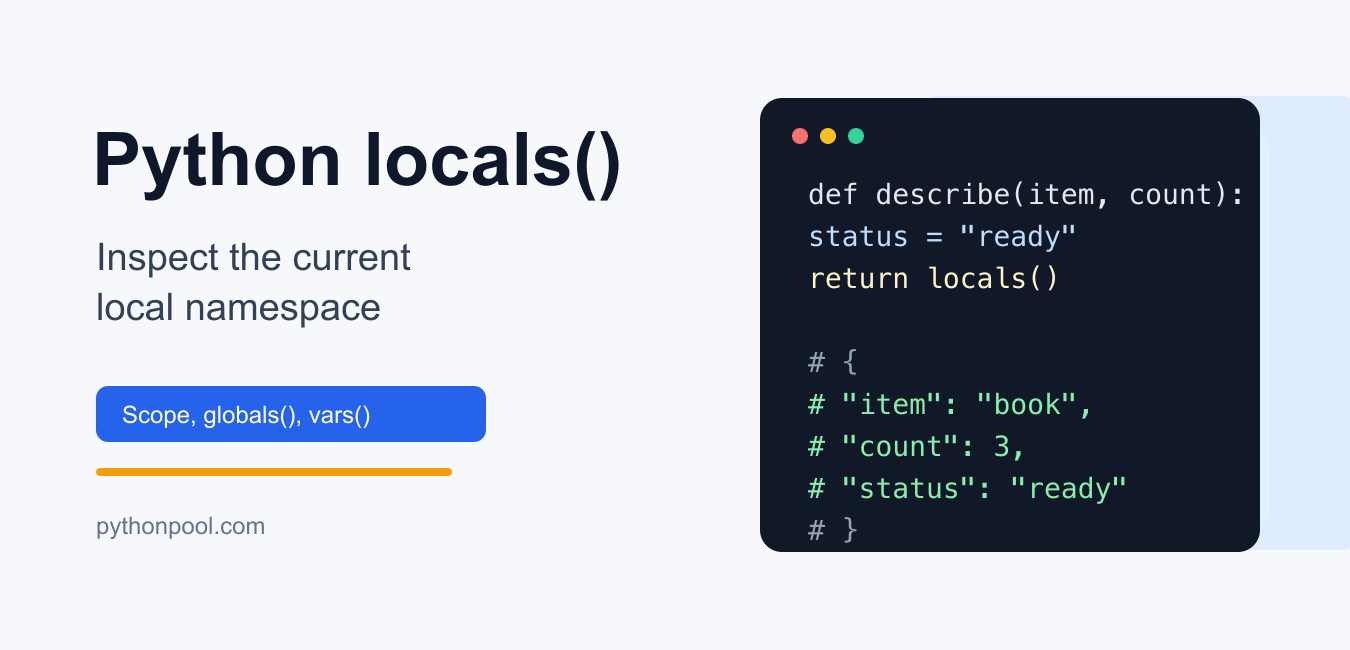
Learn what Python locals() returns, how local scope works, why modifying the returned mapping is unreliable, and safer alternatives.
Browse practical Python tutorials, error fixes, library guides, data science examples, and project ideas from Python Pool.
Learn what Python locals() returns, how local scope works, why modifying the returned mapping is unreliable, and safer alternatives.
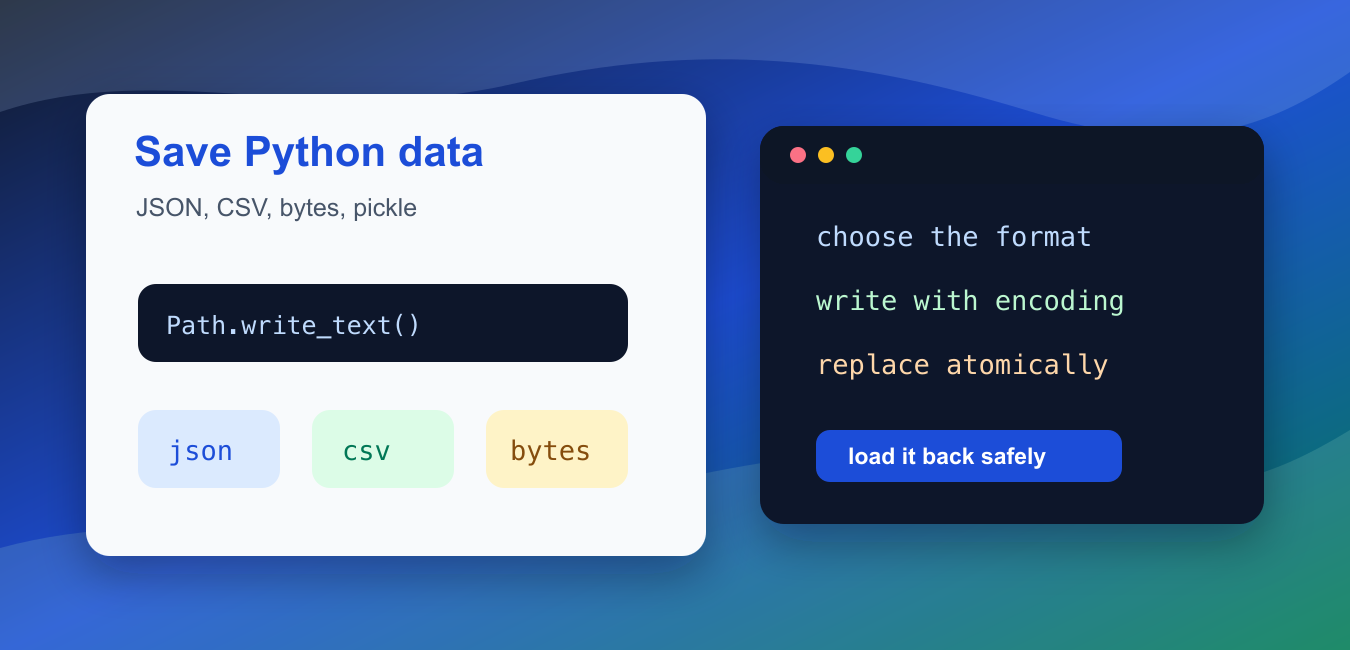
Save Python variables with JSON, pickle, or text files by matching the format to interoperability, trusted data, types, and long-term storage needs.
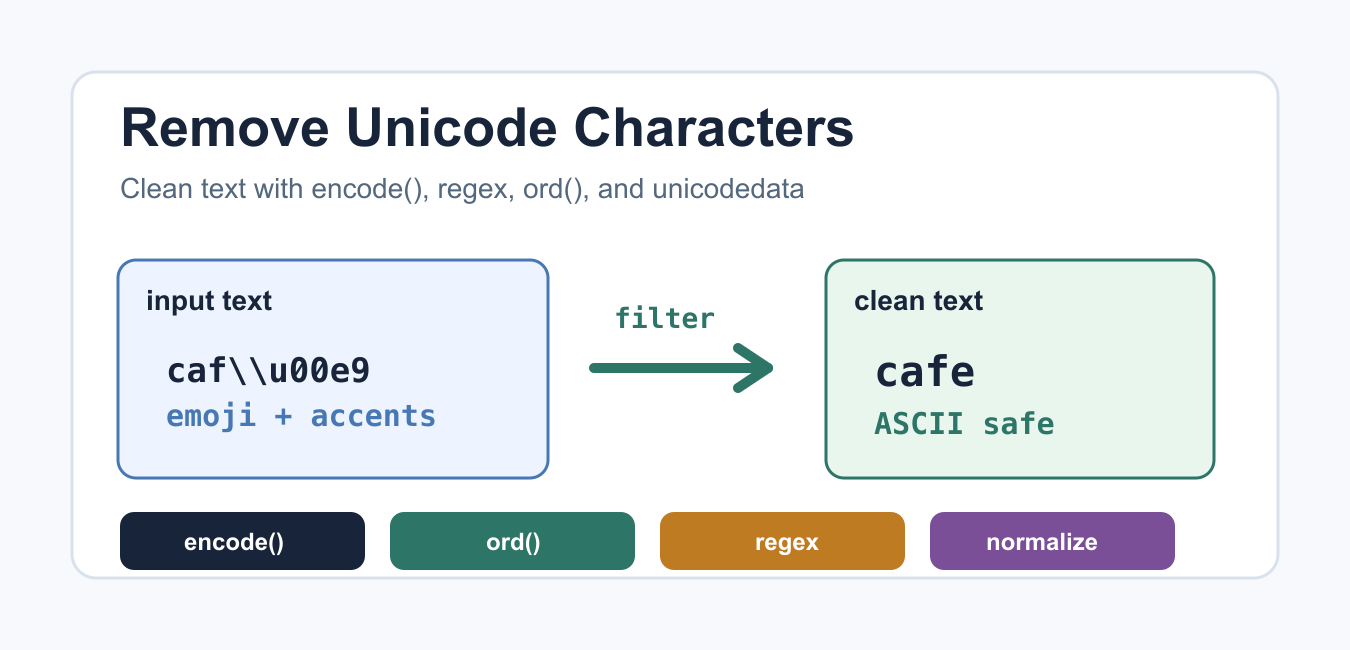
Remove or replace selected Unicode characters in Python with encode/decode, regex, translate, and normalization while preserving the text you actually need.
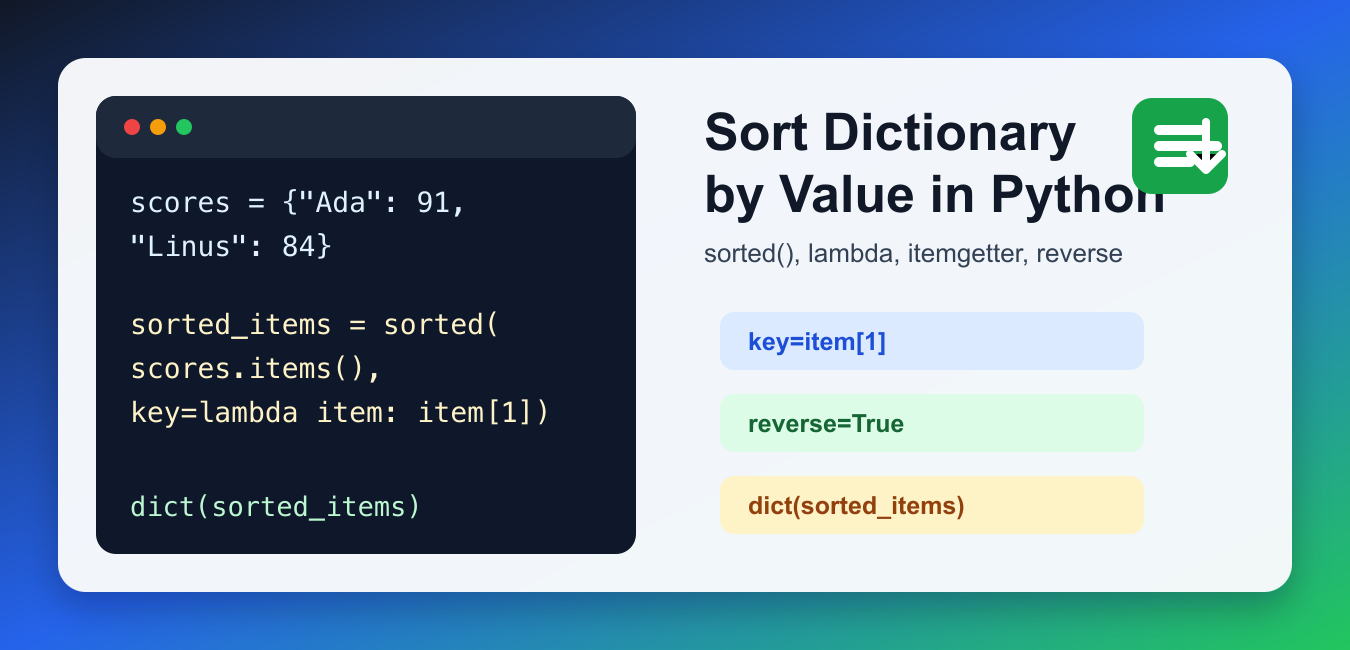
Sort Python dictionaries by value with sorted(), lambda, itemgetter, reverse order, tie-breakers, and ordered output.
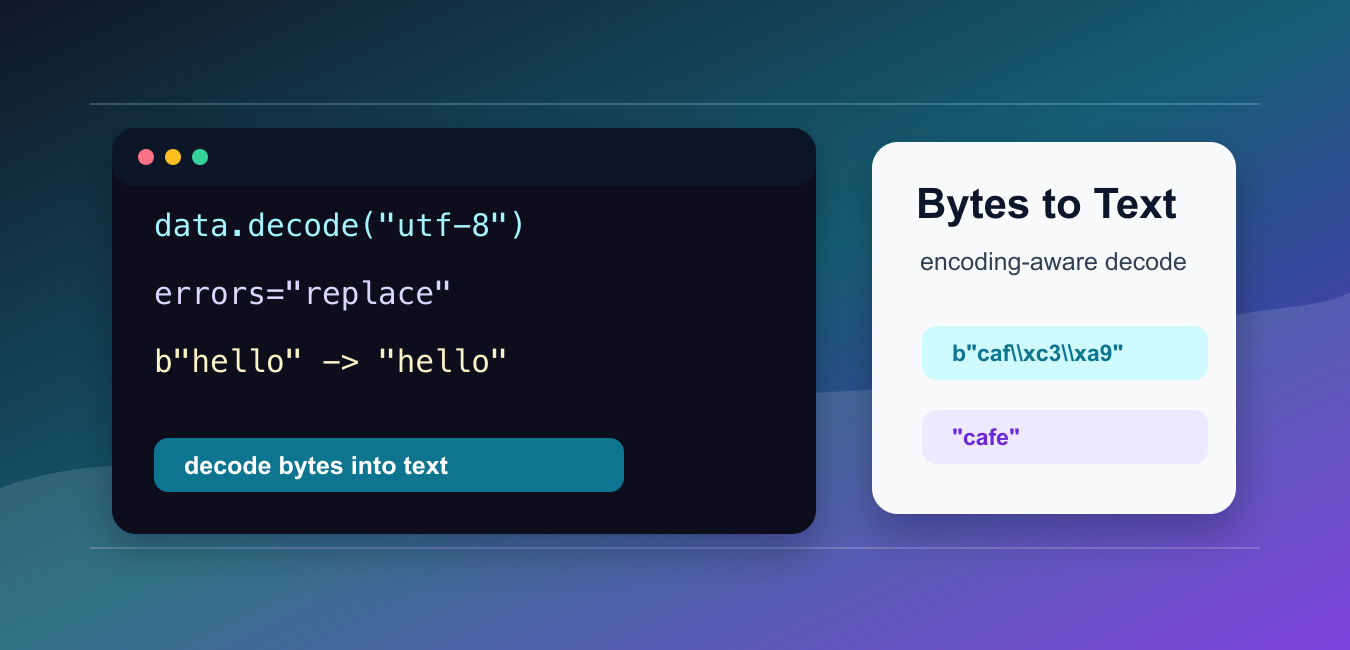
Decode Python bytes safely with an explicit encoding, handle invalid data deliberately, and keep text-versus-binary boundaries clear in files and APIs.
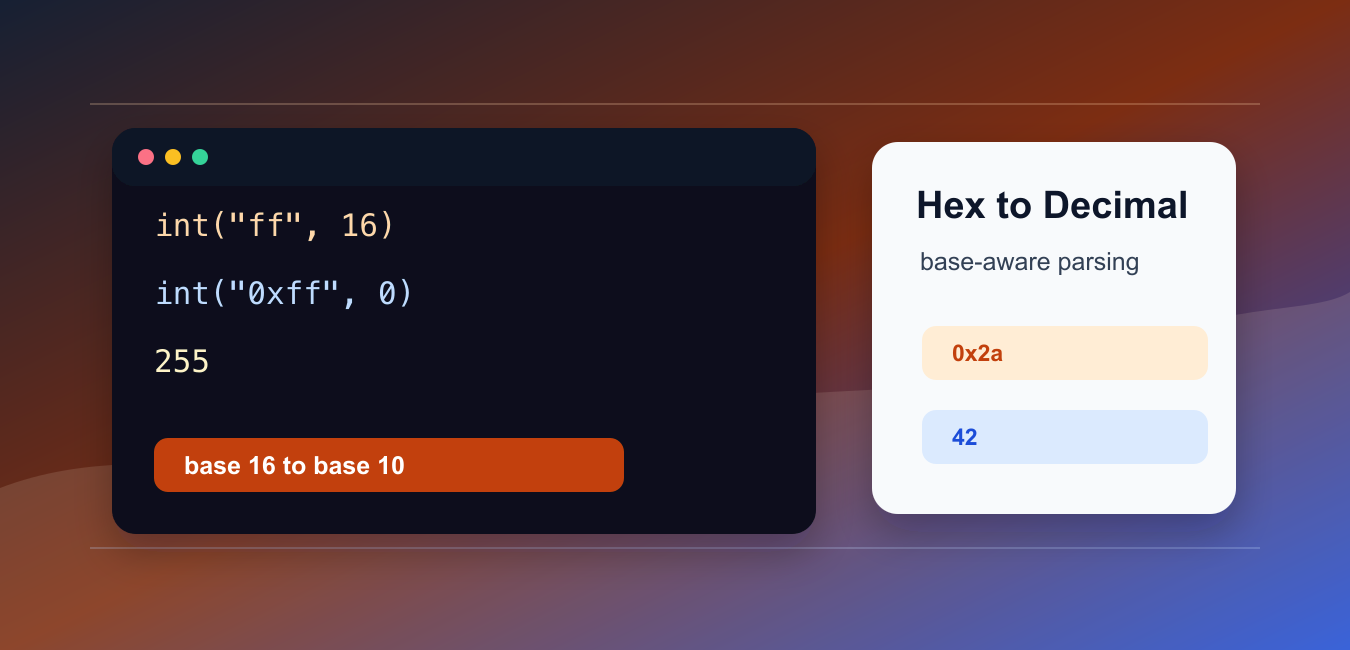
Convert hexadecimal strings to decimal integers in Python with int(base=16), handle 0x prefixes and validation, and format results safely.
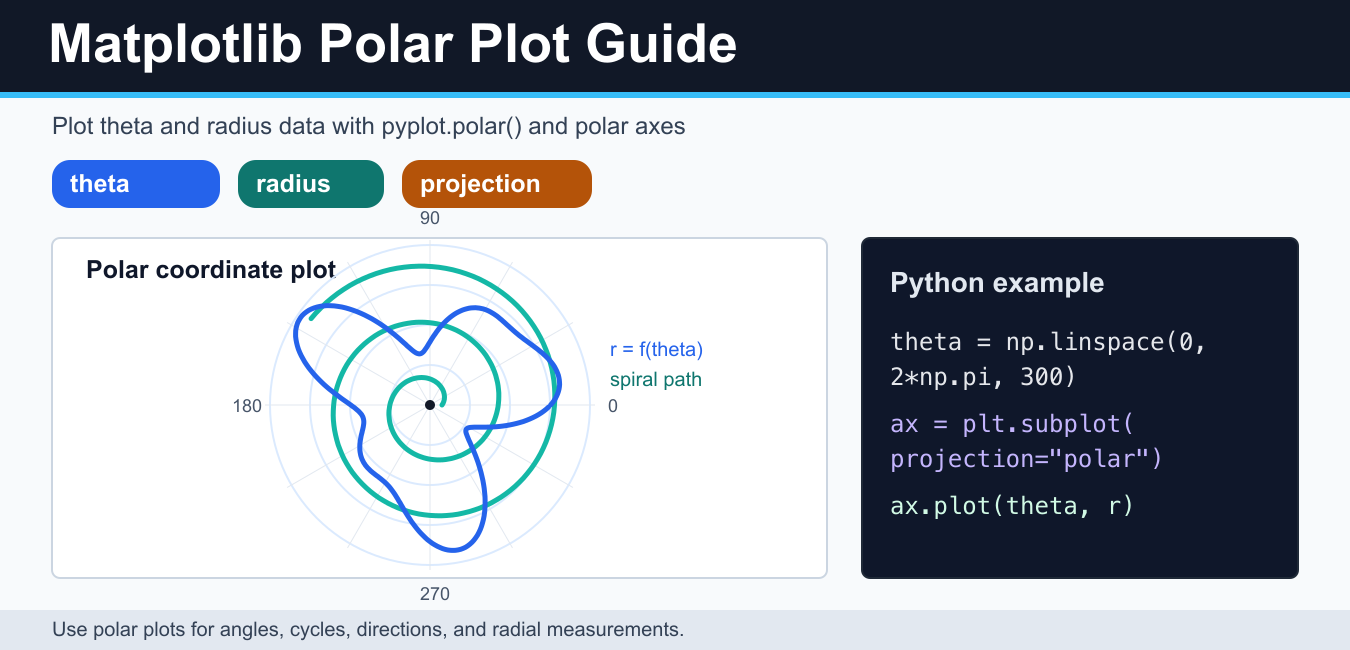
Create a Matplotlib polar plot in Python with theta values, radial data, labels, limits, grids, and readable styling for circular data.

Learn when Python semicolons separate simple statements, why one statement per line is clearer, and which syntax cannot be compressed safely.

Use NumPy count_nonzero() to count true values, threshold matches, and nonzero elements across an array or selected axes.
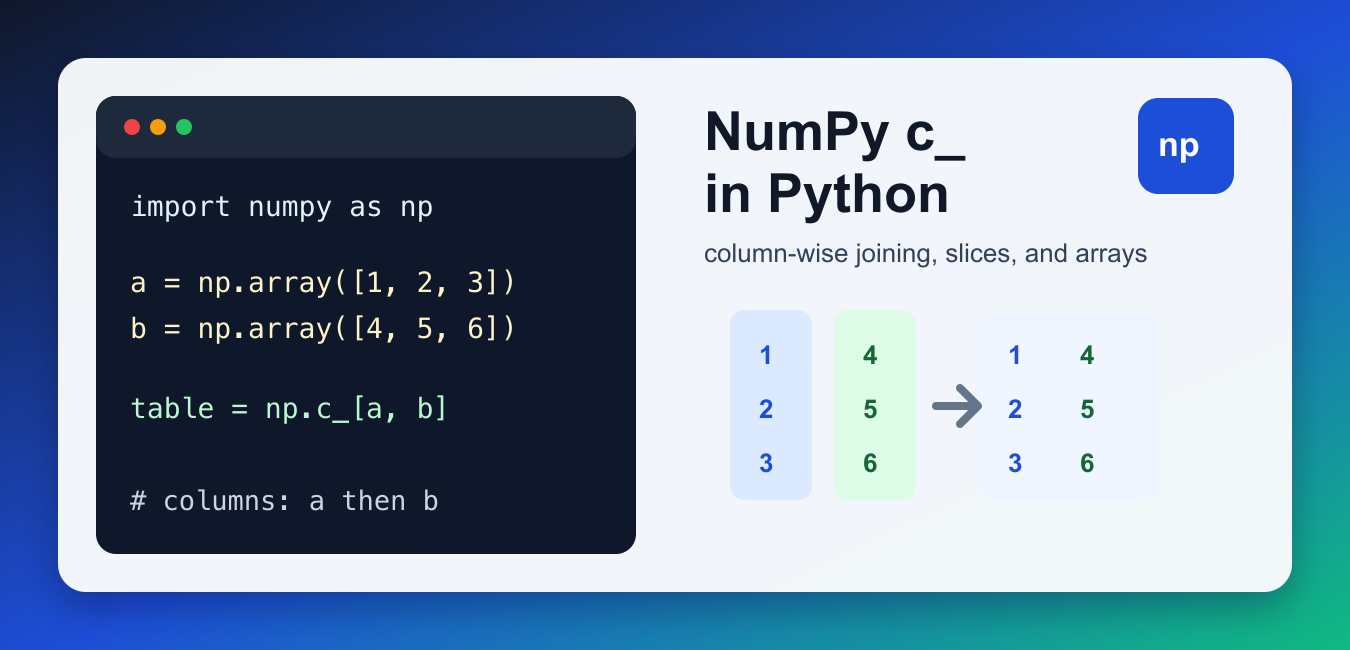
Use NumPy c_ for compact column-wise array construction, then compare its shape behavior with column_stack, r_, and concatenate.