In this article, Hello programmers, we will discuss the Matplotlib ion in Python. Matplotlib is a multi-platform data visualization library using NumPy array. The Pyplot module of the matplotlib library gives visual access to several plots like line, bar, scatter, histogram, etc.
The matplotlib.pyplot.ion() function turns on the interactive mode. By default, the interactive mode is off. After every change, some interactive backends dynamically update and pop up to users. You can check the status of interactive mode by running the plt.isinteractive() or plt.rcParams[‘interactive’].
Syntax and Return type of Matplotlib ion:
matplotlib.pyplot.ion()
Parameters
It accepts no parameters. It just turns on the interactive mode.
Examples of Matplotlib ion() in Python
EXAMPLE 1:
import matplotlib.pyplot as plt
plt.ion()
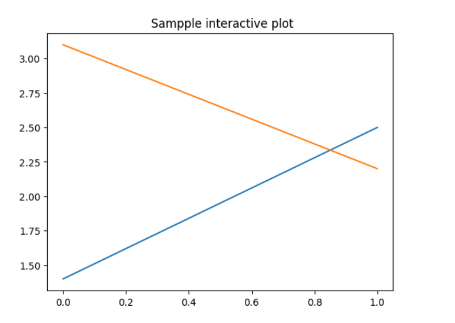
plt.plot([1.4, 2.5])
plt.title(" Sampple interactive plot")
axes = plt.gca()
axes.plot([3.1, 2.2])
OUTPUT:
EXPLANATION:
In the above example, the function implements just after importing the matplotlib library. This helps to turn on the interactive mode for the sample interactive plot created. Thus plt.ion() statement starts the ion() function.
EXAMPLE 2:
import matplotlib.pyplot as plt
#the function to turn on interactive mode
plt.ion()
#creating randomly generate collections/data
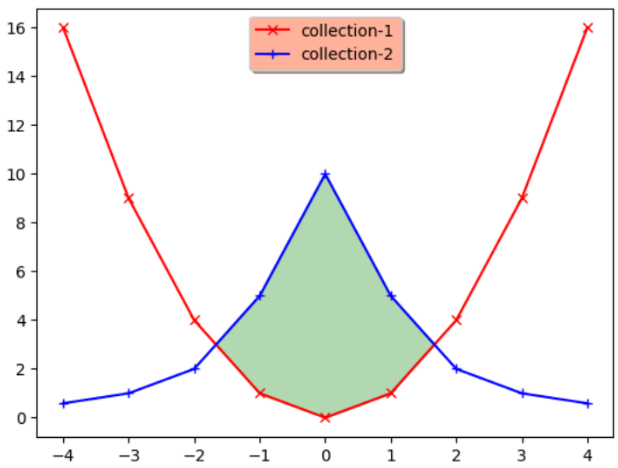
random_array = np.arange(-4, 5)
collection_1 = random_array ** 2
collection_2 = 10 / (random_array ** 2 + 1)
figure, axes = plt.subplots()
axes.plot(random_array, collection_1,
'rx', random_array,
collection_2, 'b+',
linestyle='solid')
axes.fill_between(random_array,
collection_1,
collection_2,
where=collection_2>collection_1,
interpolate=True,
color='green', alpha=0.3)
lgnd = axes.legend(['collection-1',
'collection-2'],
loc='upper center',
shadow=True)
lgnd.get_frame().set_facecolor('#ffb19a')
OUTPUT:
EXPLANATION:
In the above example, two arrays – collection_1 and collection_ 2 are defined using the Numpy arrange() function. The arrays contain the points to plot the interactive plot. The interactive mode is turned on for the above example by implementing the line plt.ion().
Update plot with draw()
import matplotlib.pyplot as plt
import numpy as np
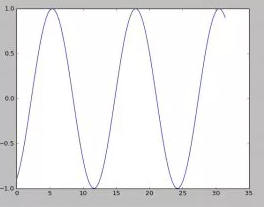
x = np.linspace(0, 10*np.pi, 100)
y = np.sin(x)
plt.ion()
fig = plt.figure()
ax = fig.add_subplot(111)
line1, = ax.plot(x, y, 'b-')
for phase in np.linspace(0, 10*np.pi, 100):
line1.set_ydata(np.sin(0.5 * x + phase))
fig.canvas.draw()
OUTPUT:
EXPLANATION:
In the above example, we first create the data to plot using the following Numpy functions: x = np.linspace(0, 10*np.pi, 100) and y = np.sin(x). The interactive mode, i.e., ion() in python, is turned on. Setting interactive mode on is essential. It controls if the figure is redrawn for every draw() command. The figure does not update itself if the plt.ion() is False (the default). The plot is configured and finally updated in a loop.
Matplotlib ion() freeze
from matplotlib import pyplot as plt
import time

plt.ion()
fig = plt.figure()
axis = fig.add_subplot(111)

for i in range(30000):
    axis.plot(i,i,'o')
    plt.draw()
    if i > 5:
        time.sleep(2)
plt.close()
EXPLANATION:
In the above code snippet, an interactive plot is made using the plt.ion() function. Some other parts of the code do some calculations, and the plot is updated frequently with calls to plt.draw(). On selecting the figure window of the interactively drawn plot and trying to move it around, the figure stops updating, and Windows tags the process “Not Responding.” But the script continues to run without a problem i.e., only the figure freezes.
Must Read Matplotlib Articles
Matplotlib Zorder Explained with Examples
Matplotlib Annotate Explained with Examples
6 Ways to Plot a Circle in Matplotlib
Conclusion
This article talks about the Matplotlib ion() in Python. And examples of implementing the function in python programs. I turn on the interactive mode for various plots. Refer to this article for any queries related to the Matplotlib ion() function.
Matplotlib library has provided thousands of functions, which helps us develop graphs quickly. With pre-designed examples, you can easily plot graphs. This unbelievable creation of the library allowed data analysts to use it.
However, if you have any doubts or questions, do let me know in the comment section below. I will try to help you as soon as possible.
Happy Pythoning!
Update plot with draw() and Matplotlib ion() freeze plot initially but don’t refresh the graph. Have you got an idea. Thanks.
This is because your main execution is running before your plot is shown. Use plt.pause(time) to wait for the plot to refresh. Moreover, make sure you supply new data above plt.pause() method.
Example –
import numpy as npimport matplotlib.pyplot as plt
plt.ion()
plt.axis([0, 10, 0, 1])
for i in range(10):
y = np.random.random()
plt.scatter(i, y)
plt.pause(0.05)
plt.show(block=False)
plt.pause(100)
Edit: Probably discus comment formatting removes the indentation of for blocks. 3 lines after the for loop in code are indented.
Unfortunately. It doesn’t work. Only an empty plot.
Can you email me your code at [email protected]?