
Hello programmers, in this article, we will study the Matplotlib savefig() in python. As we all know, Matplotlib is a beneficial visualization library in python, especially for plotting purposes. The Matplotlib savefig function, as the name suggests, helps save the figure after plotting the data. Finally, it saves the figure in the local memory of our system. Let me brief you with the syntax and return type of the Matplotlib savefig() function.
Syntax of Matplotlib savefig()
savefig(fname, dpi=None, facecolor=’w’, edgecolor=’w’, orientation=’portrait’, papertype=None, format=None, transparent=False, bbox_inches=None, pad_inches=0.1, frameon=None, metadata=None)
Parameters:
- fname: (str or path-like or file-like) It determines the output format, and the file saves as fname. If the format is not present, then the format is the extension of fname, if there is one. If the fname has no extension, then the file is saved with default: ‘png,’ and the appropriate extension is appended to the fname.
- dpi: Resolution in dots per inch.
- facecolor(color or ‘auto’, default: ‘auto’): The facecolor of the figure. If ‘auto’, use the current figure facecolor.
- edgecolor(color or ‘auto’, default: ‘auto’): The edgecolor of the figure. If ‘auto’, use the current figure edgecolor.
- orientation – {‘landscape,’ ‘portrait’}: Currently only supported by the postscript backend.
- format(str): The file format, e.g. ‘png’, ‘pdf’, ‘svg’, … The behavior when this is unset is documented under fname.
- papertype: Papertypes can be “a0 to a10”, “executive,” “b0 to b10”, “letter,” “legal,” “ledger.”
- bbox_inches: Only a given portion of the figure is saved. Set it as “tight” for the proper fit of the saved figure.
- pad_inches: (default: 0.1) Amount padding around the saved figure.
- transparent: Makes the background of the picture transparent. The figure patch will also be transparent unless face color and/or edgecolor are specified via kwargs.
Return type
The matplotlib savefig() function saves the plotted figure in our local machines.
Example of Matplotlib Savefig() in Python
import matplotlib.pyplot as plt
# creating plotting data
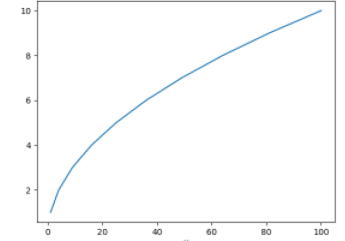
x_axis =[1, 4, 9, 16, 25, 36, 49, 64, 81, 100]
y_axis =[1, 2, 3, 4, 5, 6, 7, 8, 9, 10]
# plotting
plt.plot(x_axis, y_axis)
plt.x_label("X")
plt.y_label("Y")
# saving the file
plt.savefig("squares.png")
plt.show()
OUTPUT:
EXPLANATION:
In the above example, a plot is drawn using the input values of the x_axis and y_axis. Once the plotting is over, it is first saved using the savefig() function. Only the ‘fname,’ given as “Squares.png,” is an argument to the matplotlib savefig() function. The plotted figure is thus saved with the file name Squares under .png format in the local system.
Savefig() with other parameters
import matplotlib.pyplot as plt


# creating data and plotting a histogram
x =[1, 4, 9, 16, 25, 36, 49, 64, 81, 100]
plt.hist(x)

# saving the figure.
plt.savefig("squares1.png",
            bbox_inches ="tight",
            pad_inches = 1,
            transparent = True,
            facecolor ="g",
            orientation ='landscape')

plt.show()
OUTPUT:

EXPLANATION:
Firstly, in the above example, a histogram is plotted by importing the Matplotlib library using the various input values. The figure is saved in the local system using the Matplotlib savefig() in Python. Parameters as arguments are necessary to obtain the saved figure as desired. The ‘fname’ is “Squares.png,” which saves the figure under file name Squares and .png format. The bbox_inches =”tight” save the figure in a tight fit. And pad_inches = 1 gives padding of 1 around the saved figure. Also, the facecolor is ‘g,’ which gives the green color. Finally, the orientation is ‘landscape,’ which saves the figure in landscape mode.
Matplotlib Savefig() formats
import numpy as np
import matplotlib.pyplot as plt
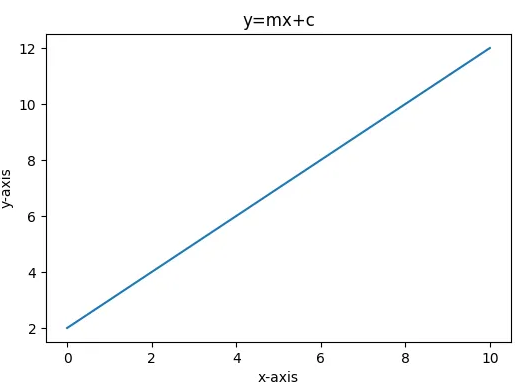
x = np.linspace(0, 10,20)
m = 1
c = 2
y = m*x + c
fig = plt.figure()
plt.plot(x, y)
plt.title("y=mx+c")
plt.xlabel('x-axis')
plt.ylabel('y-axis')
fig.set_size_inches(5, 5)
plt.savefig("Figure saved in jpg format.jpg")
EXPLANATION:
Firstly, to change the figure format using the Matplotlib savefig() function, we need to change the extension of the image file name in the savefig() function. In the above example, the file name’s extension in the savefig() method is .jpg, which saves the figure in jpg format. We can save plots in different formats like .png, .jpg, .pdf, .svg, and many more just by changing the files’ extensions to save as desired in the savefig() methods.
Change size using Matplotlib Savefig() in Python
import numpy as np
import matplotlib.pyplot as plt

x = np.linspace(0, 10, 0.5)
m = 1
c = 2
y = m*x + c

plt.figure(figsize=(10, 10))
plt.savefig('750x750.png', dpi=75)
plt.plot(x, y)
plt.title("y=mx+c")
plt.xlabel('x-axis')
plt.ylabel('y-axis')

plt.show()
OUTPUT:
EXPLANATION:
To change the figure’s size using savefig(), we need to set the figure dimension in inches while instantiating the figure. And later, the dpi (Resolutions in dots per inch) is specified so that the dimensions of the saved image are correct.
Conclusion
In today’s article, we learned how to save figures with real-time examples using the plt.savefig() function. We used different methods and different combinations of parameters as per our choice. The best coding practice is to try all possible combinations of methods and parameters. Refer to this article for any queries related to the Matplotlib savefig() in Python.
However, if you have any doubts or questions, do let me know in the comment section below. I will try to help you as soon as possible.
Happy Pythoning!