Quick Answer
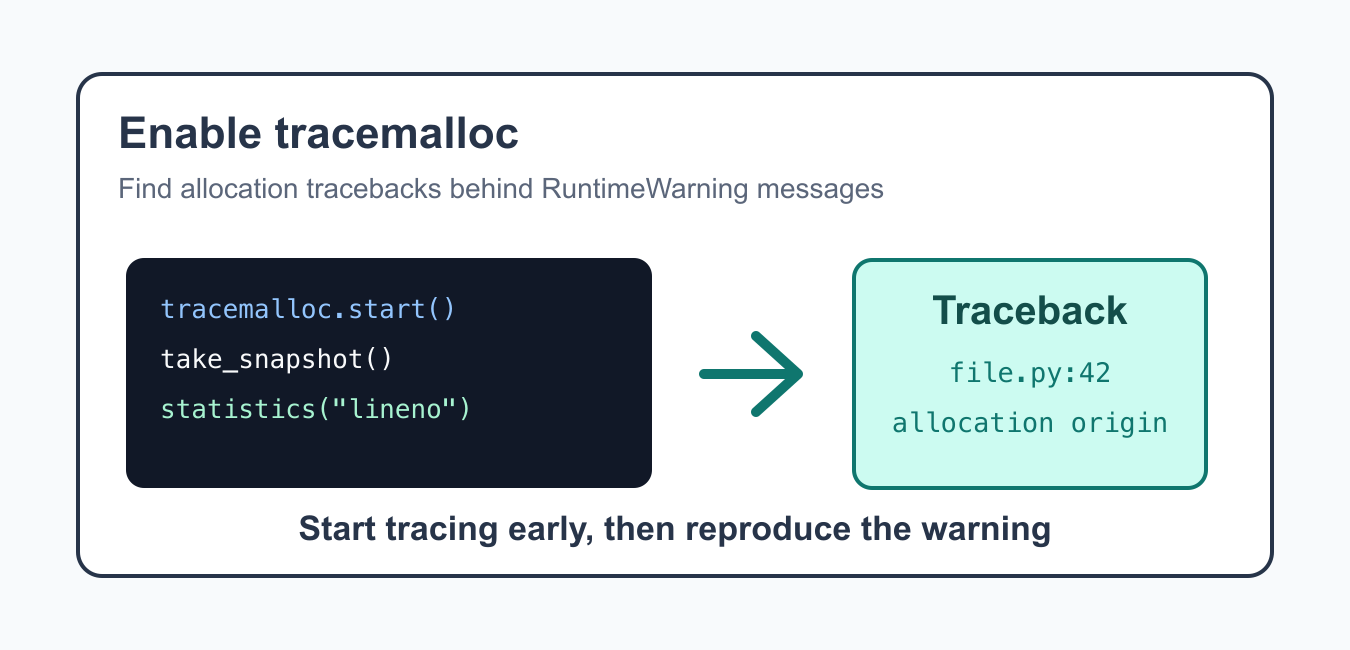
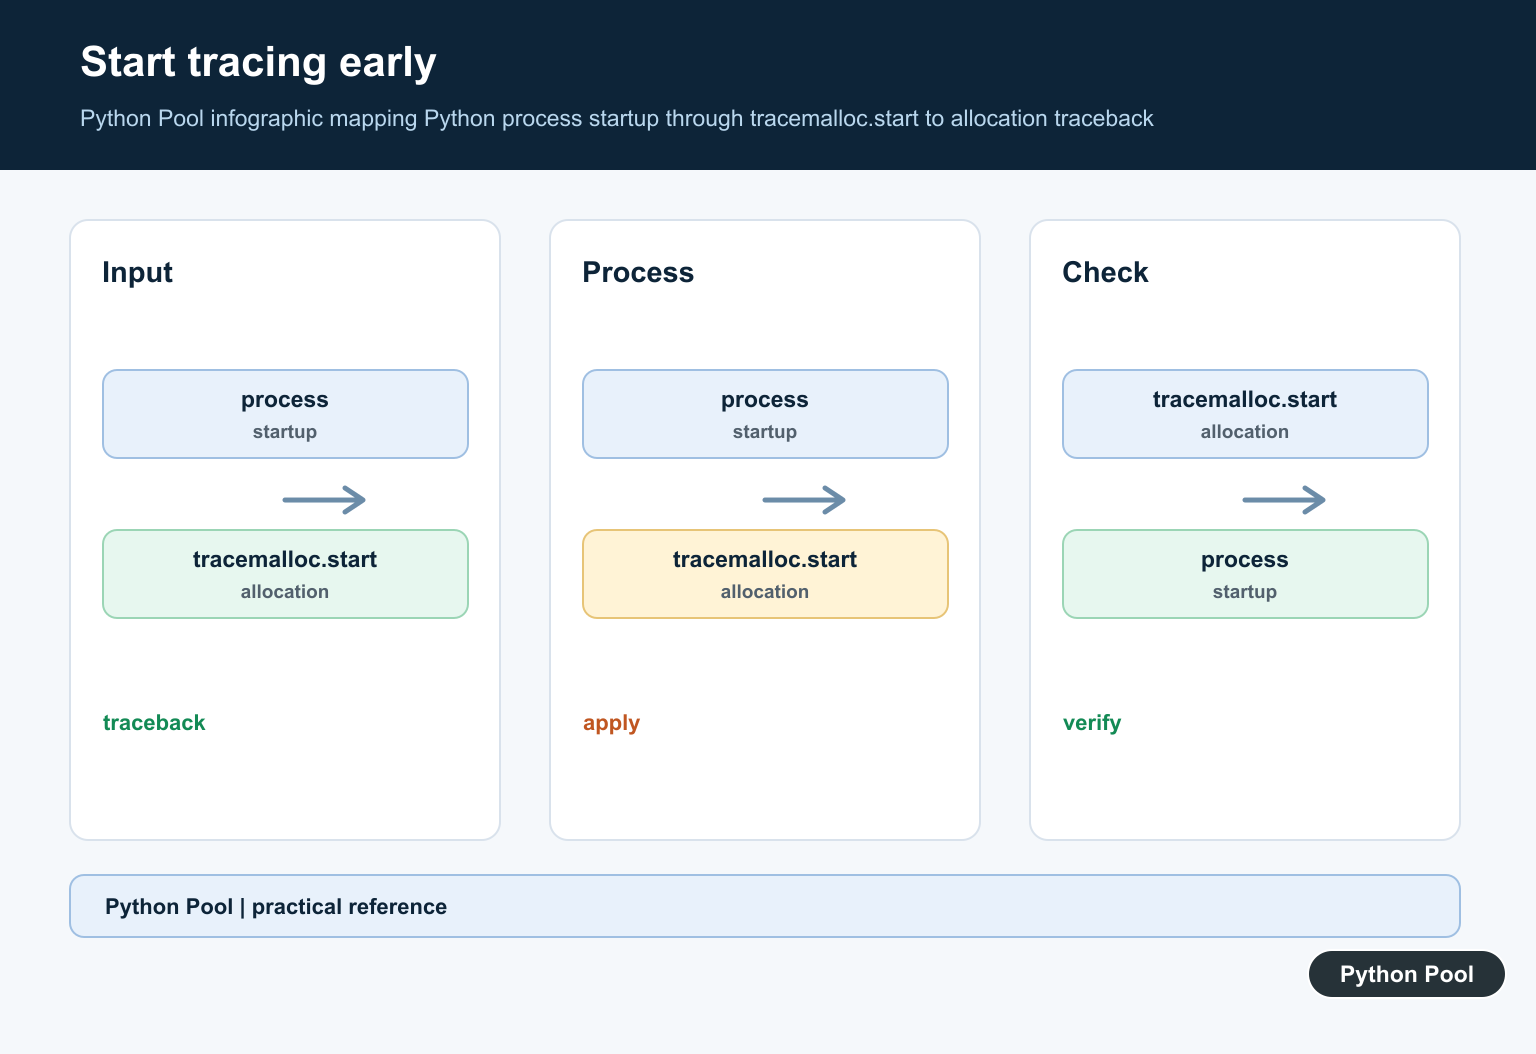
Start tracemalloc before the object or coroutine is created, using tracemalloc.start() or python -X tracemalloc. Then take snapshots and compare them. Enabling it later cannot reconstruct allocation traces for objects created before tracing began.
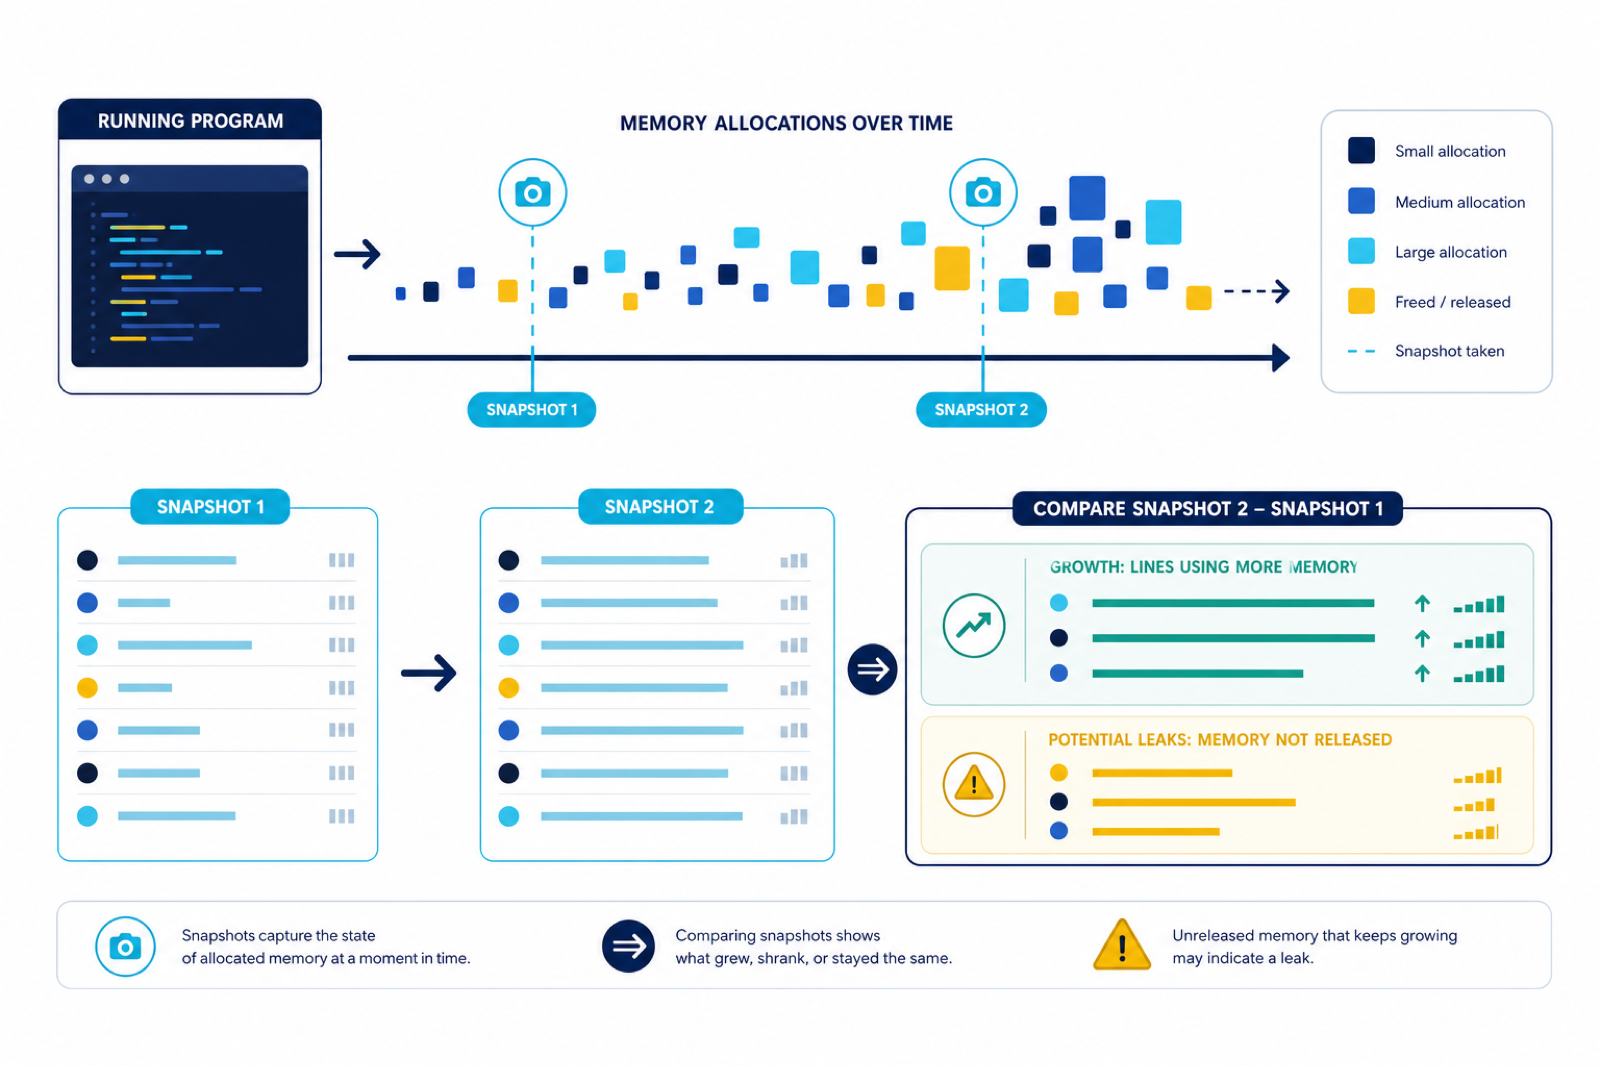
The warning RuntimeWarning: enable tracemalloc to get the object allocation traceback means Python can show where an object was awaited, closed, or reported incorrectly, but it cannot show where that object was originally allocated because memory tracing was not enabled soon enough.
This warning often appears while debugging coroutine warnings, resource warnings, or memory-related diagnostics. Enabling tracemalloc does not fix the underlying bug by itself. It gives Python more context so the traceback points closer to the allocation site.
That distinction matters because the warning is asking for better evidence, not for a blanket workaround. Once tracing is enabled, you still need to read the allocation traceback and correct the code path that created the object without using it correctly.
The official tracemalloc documentation, warnings module documentation, asyncio coroutine documentation, and Python -X command-line documentation are the primary references.
Enable tracemalloc In Code
Start tracemalloc near the beginning of the program, before the objects you want to trace are created.
import tracemalloc

tracemalloc.start()

data = [bytearray(1024) for _ in range(10)]

print(tracemalloc.is_tracing())
print(len(data))
Starting it later may still help future allocations, but it cannot recover allocation traces for objects that already existed.
In a script, put this near the top of the entry point. In tests, enable it before the failing test creates the object. In a long-running service, enable it before handling the request or task you want to inspect.
Take A Memory Snapshot
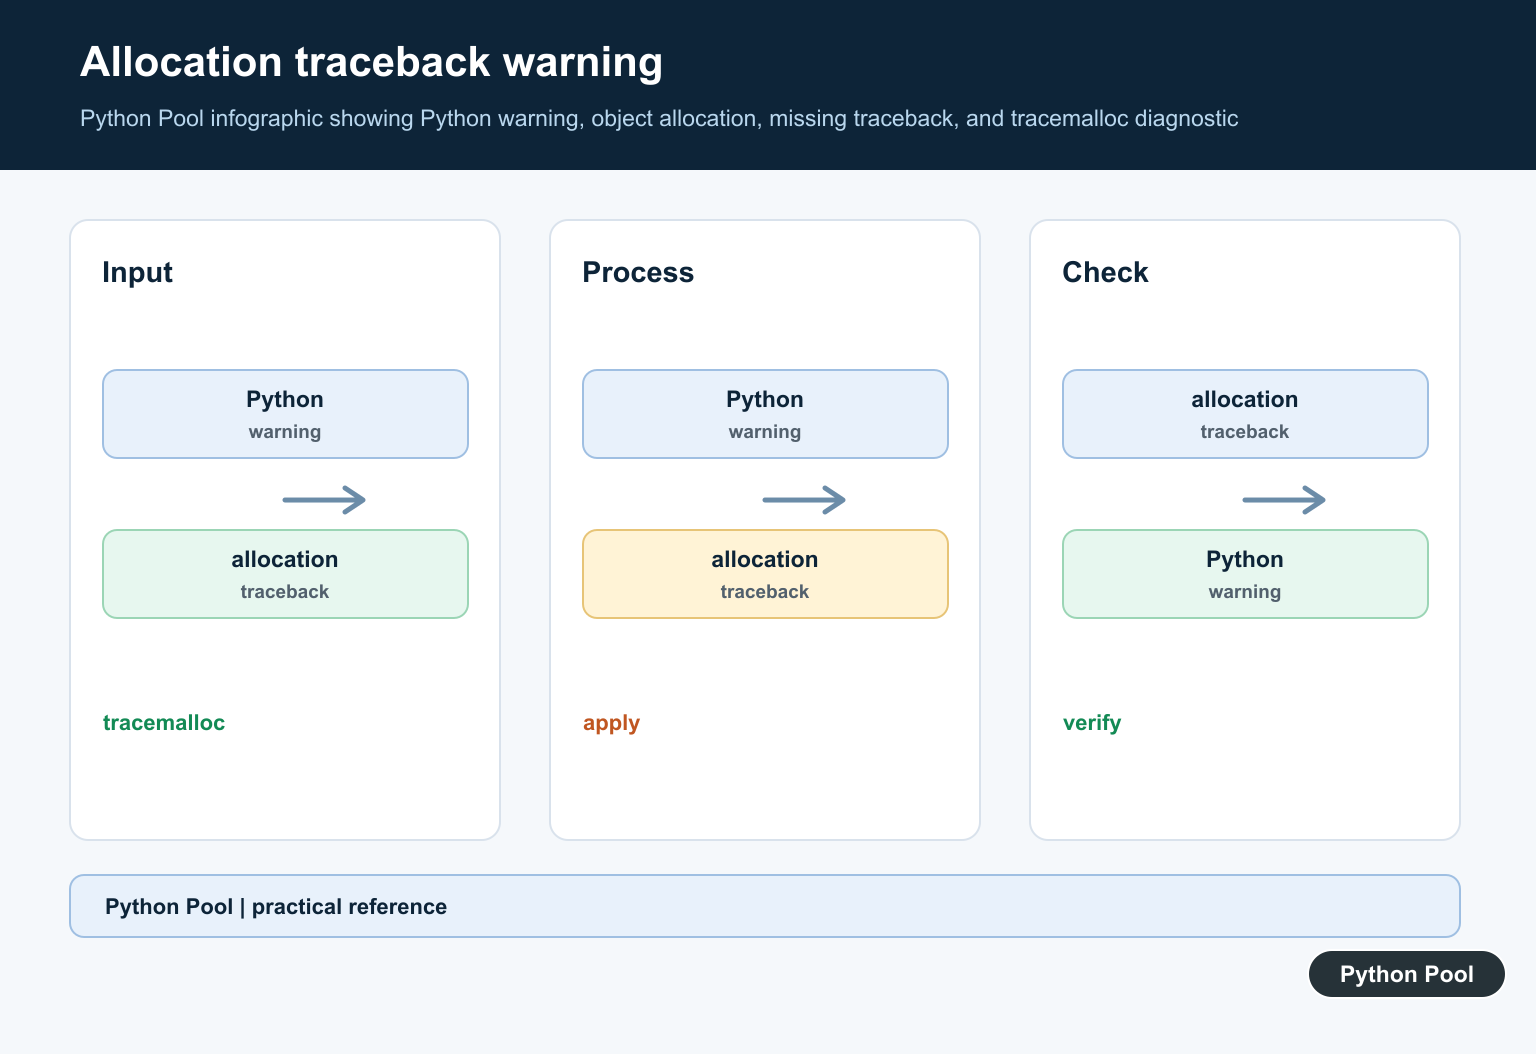
A snapshot lets you inspect where memory was allocated after tracing started.
import tracemalloc

tracemalloc.start()

items = [list(range(1000)) for _ in range(20)]
snapshot = tracemalloc.take_snapshot()

for stat in snapshot.statistics("lineno")[:3]:
    print(stat)

print(len(items))
The lineno grouping shows file and line information. This is useful when looking for allocation-heavy code paths.
Snapshot output is most useful when the reproduction is small. If the program allocates thousands of unrelated objects before the warning appears, reduce the example or compare snapshots around the specific operation.
Show More Traceback Frames
You can ask tracemalloc to keep more stack frames for each allocation. More frames give better context but use more memory.
import tracemalloc

tracemalloc.start(10)

values = [tuple(range(50)) for _ in range(100)]
snapshot = tracemalloc.take_snapshot()
top = snapshot.statistics("traceback")[0]

print(top.size)
for line in top.traceback.format():
    print(line)

print(len(values))
Use a modest frame count while debugging. Very deep traces can add noise and overhead.
More frames help when the allocation happens inside a helper function and the caller is more meaningful than the exact allocation line. Start with a small number, then increase it only if the first traceback lacks context.
Compare Two Snapshots
Comparing snapshots helps identify what changed between two points in a program.
import tracemalloc

tracemalloc.start()

before = tracemalloc.take_snapshot()
cache = {"numbers": [n for n in range(5000)]}
after = tracemalloc.take_snapshot()

for stat in after.compare_to(before, "lineno")[:3]:
    print(stat)

print(cache["numbers"][0])
This pattern is useful when a request, task, or function appears to allocate more memory than expected.
Comparison output shows growth between two moments. It is not a complete leak detector by itself, but it can point to the function or line that deserves closer review.
Turn Warnings Into Visible Clues
During debugging, configure warnings so they are visible and easy to reproduce.
import warnings

warnings.simplefilter("default", RuntimeWarning)

warnings.warn(
    "example runtime warning",
    RuntimeWarning,
    stacklevel=1,
)
For application tests, you may choose a stricter filter. For interactive debugging, showing the warning once may be enough.
Warnings can be hidden by default depending on the category and runtime context. Make them visible while debugging so you do not miss the first line that explains what Python noticed.
Check Tracing Status
Before relying on allocation tracebacks, confirm that tracing is active.
import tracemalloc

if not tracemalloc.is_tracing():
    tracemalloc.start()

current, peak = tracemalloc.get_traced_memory()

print(current)
print(peak)
get_traced_memory() reports memory tracked by tracemalloc, not every byte used by the operating system. Treat it as a Python allocation diagnostic, not a full system memory monitor.
If tracing is already active, avoid starting and stopping it repeatedly in unrelated helper functions. Keep tracing setup near the diagnostic entry point so the output is predictable.
Practical Checklist
Enable tracemalloc at program startup, reproduce the warning, then read the extra allocation information beside the normal traceback. If the warning involves an unawaited coroutine, fix the coroutine lifecycle after finding where it was created.
You can also enable tracing from the command line with Python’s -X tracemalloc option. That is useful when you cannot edit the program before startup.
For coroutine warnings, the final fix is usually to await the coroutine, schedule it properly, or remove the call that creates it. Tracemalloc helps locate where it was created so you can fix that lifecycle mistake directly.
The reliable pattern is to start tracing early, reproduce the warning with a small example, inspect allocation traces, and then fix the real cause. Tracing is the diagnostic tool, not the final fix.
Compare Snapshots Instead of Guessing
The allocation traceback warning asks for better evidence. A single snapshot shows the current state; a comparison shows which files or lines grew between two points in the program.
import tracemalloc

tracemalloc.start(10)
before = tracemalloc.take_snapshot()
items = [list(range(1000)) for _ in range(20)]
after = tracemalloc.take_snapshot()

for stat in after.compare_to(before, 'lineno')[:5]:
    print(stat)
Use this with a repeatable workload and keep the tracing window focused. tracemalloc tracks Python allocations; native extensions may require separate profilers or diagnostics.
For the surrounding debugging workflow, see Python traceback handling and Python tracing before deciding whether to suppress a warning.
Frequently Asked Questions
Does enabling tracemalloc fix the underlying warning?
No. It adds allocation traceback information so you can locate the code path. You still need to correct the coroutine, resource, or memory-lifecycle issue that triggered the warning.
When should tracemalloc.start() run?
Start it before the objects you want to investigate are allocated. Starting later cannot recover traceback data for earlier allocations.
What does compare_to() show?
It compares two snapshots and reports allocation differences grouped by a key such as filename and line number, helping identify growth between checkpoints.
Does tracemalloc measure all process memory?
No. It primarily traces Python memory allocations. Native extensions and operating-system allocations may need another tool or profiler.