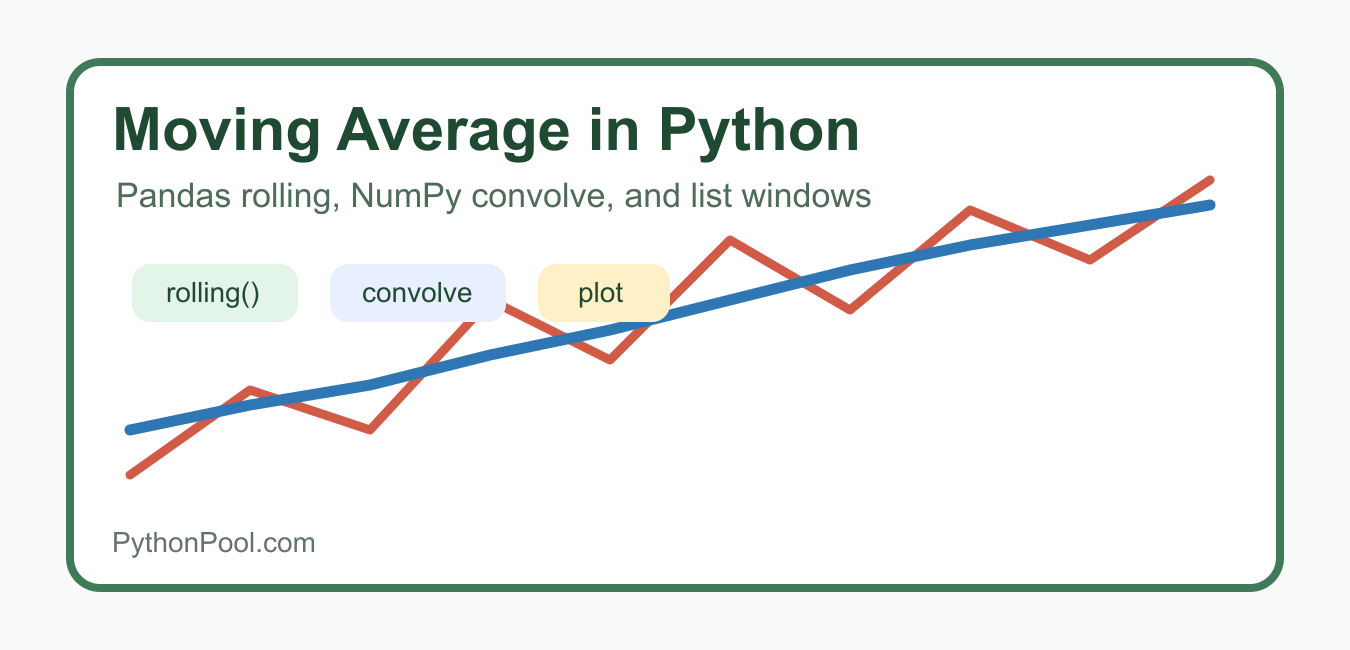
Quick answer: A moving average smooths a sequence by averaging values inside a window. Choose a centered or trailing window, define edge alignment, normalize weights when using a weighted average, and prevent future observations from entering a predictive feature.
A moving average smooths noisy data by replacing each point with the average of nearby values. In Python, the best method depends on your data shape: use Pandas for time series, NumPy for numeric arrays, and a small helper function for plain lists. A cumulative-sum window is an efficient moving-average technique; NumPy cumsum() Function in Python explains cumsum itself, axes, dtypes, and overflow behavior.
This guide covers simple moving averages, centered windows, missing values, NumPy convolution, and plotting the original series against the smoothed result.
Quick Method Guide
| Data | Recommended method | Why |
|---|---|---|
| Pandas Series or DataFrame | rolling().mean() |
Handles indexes, windows, and missing values cleanly |
| NumPy array | np.convolve() |
Fast vectorized smoothing for one-dimensional arrays |
| Small Python list | Manual window loop | No external dependency needed |
| Charting | Matplotlib line plot | Compare raw and smoothed values visually |
Moving Average with Pandas rolling()
For time series or tabular data, Pandas is usually the clearest option. The official pandas.Series.rolling() documentation covers fixed-size windows, minimum periods, centered windows, and time-based windows.
import pandas as pd

sales = pd.Series([10, 14, 13, 18, 21, 19, 25])
smoothed = sales.rolling(window=3).mean()

print(smoothed)
The first two rows are missing because a window of three values is not available yet. That is usually correct for analytics because it avoids pretending there is enough data before the window fills.
Use min_periods for Early Rows
If you want values before the full window is available, pass min_periods. This makes the first rows easier to plot, but remember that early values are based on fewer observations.
import pandas as pd

sales = pd.Series([10, 14, 13, 18, 21, 19, 25])
smoothed = sales.rolling(window=3, min_periods=1).mean()

print(smoothed)
When your data has dates, keep the date index attached. That makes the output easier to join, plot, and compare with calendar-based features. For market-calendar workflows, see PythonPool’s guide to pandas_market_calendars.
Centered Moving Average
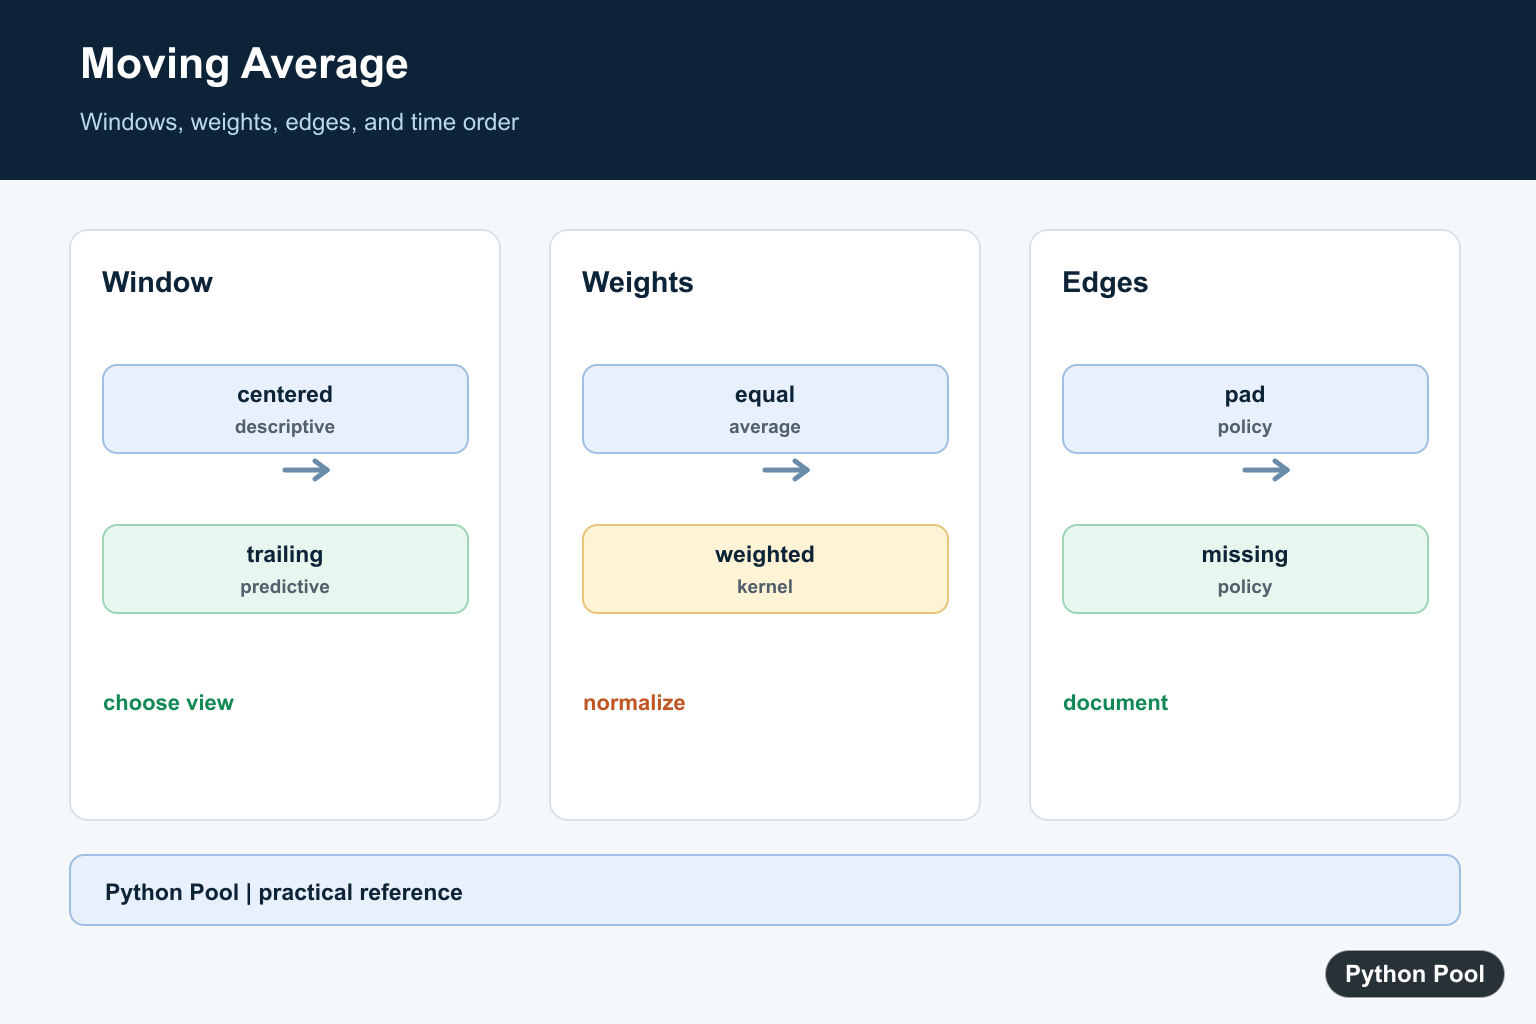
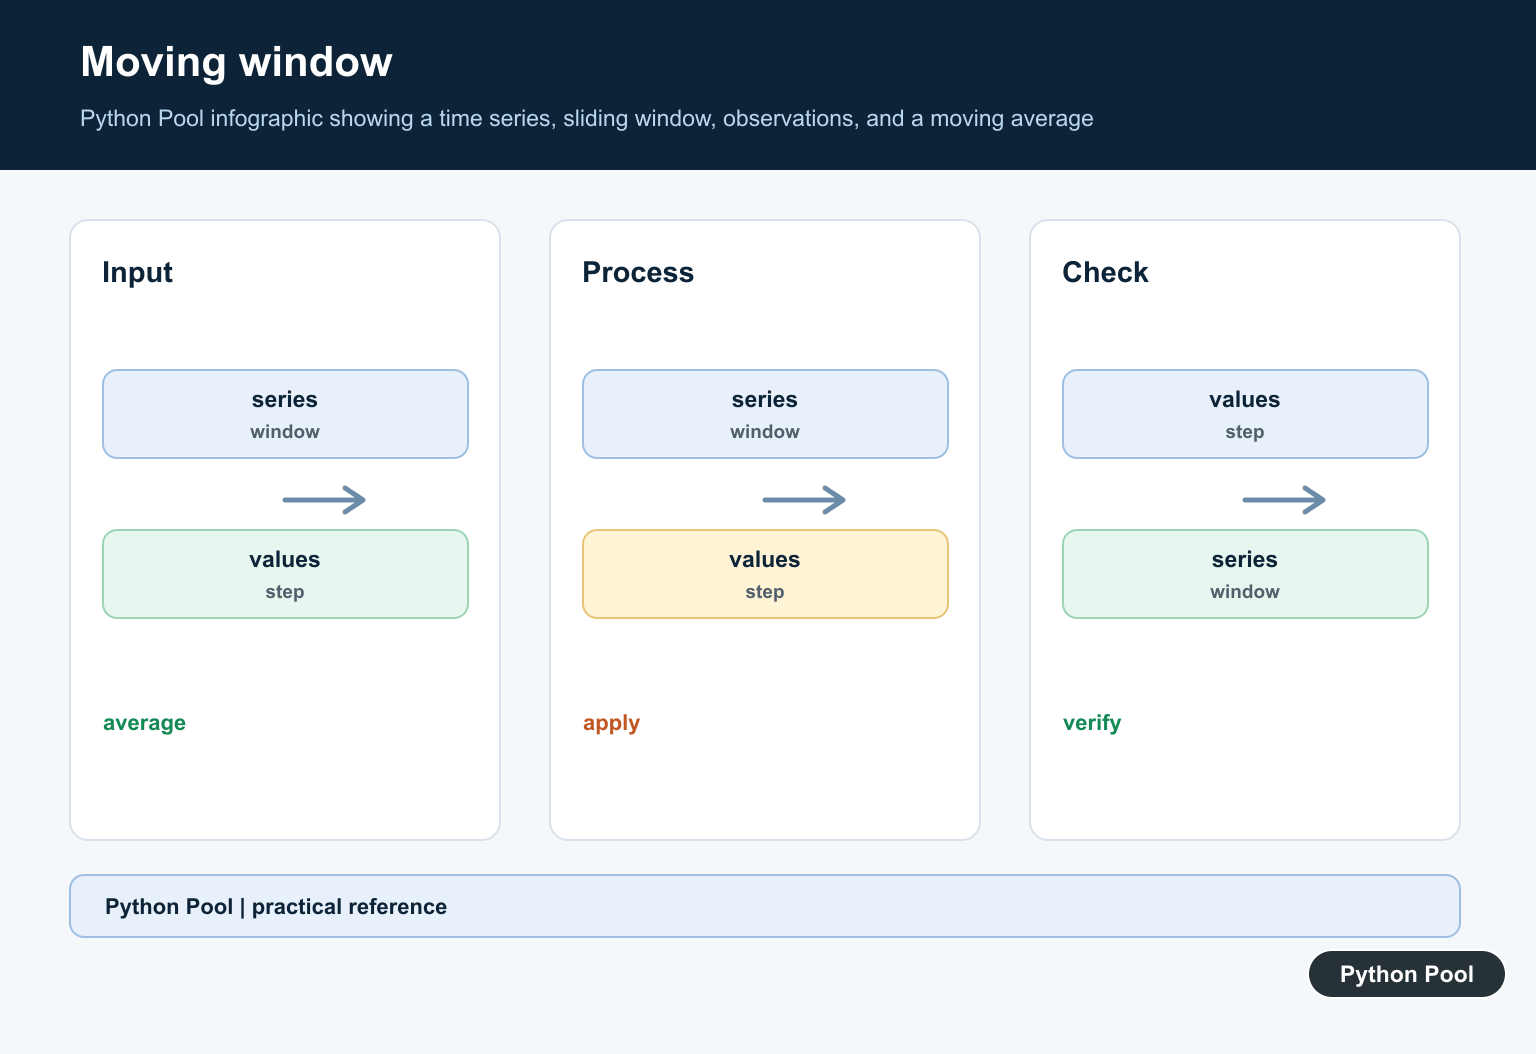
By default, Pandas labels each moving average at the right edge of the window. Use center=True when you want the smoothed value aligned with the middle of the window instead.
import pandas as pd

values = pd.Series([4, 7, 9, 6, 11, 15, 14])
centered = values.rolling(window=3, center=True).mean()

print(centered)
A centered average is useful for visualization, but it can be wrong for forecasting because it uses future values. For a model that predicts tomorrow, use only past and current observations.
Moving Average with NumPy convolve()
For a one-dimensional numeric array, numpy.convolve() can compute a simple moving average by convolving the data with equal weights. NumPy’s official convolve() reference explains the available modes.
import numpy as np

values = np.array([10, 14, 13, 18, 21, 19, 25])
window = 3
weights = np.ones(window) / window

moving_average = np.convolve(values, weights, mode="valid")
print(moving_average)
The valid mode returns only positions where the full window overlaps the data. If you need output with the same length as the input, study the boundary behavior carefully before using same. The moving-average calculation here is one application of discrete convolution; NumPy convolve: 1D Convolution Modes explains full, same, and valid modes directly.
Moving Average for a Plain List
For small scripts, a plain Python function is fine. Use statistics.fmean() for a fast floating-point mean from the standard library. Python documents it in the statistics.fmean() reference.
from statistics import fmean

def moving_average(values, window):
    if window <= 0:
        raise ValueError("window must be positive")
    return [
        fmean(values[index:index + window])
        for index in range(len(values) - window + 1)
    ]

print(moving_average([10, 14, 13, 18, 21, 19, 25], 3))
This function is easy to test and does not need Pandas or NumPy. Use it when the dataset is small and you do not need indexes, missing-value handling, or vectorized performance.
Plot Raw Data and Moving Average
A moving average is easier to judge visually. Plot the original data and smoothed data together. Matplotlib's official pyplot.plot() reference documents the line-plot API.
import pandas as pd
import matplotlib.pyplot as plt

sales = pd.Series([10, 14, 13, 18, 21, 19, 25])
smoothed = sales.rolling(window=3, min_periods=1).mean()

plt.plot(sales.index, sales, label="Raw")
plt.plot(smoothed.index, smoothed, label="3-point moving average")
plt.legend()
plt.show()
If you also need uncertainty bands, compare this with PythonPool's Matplotlib errorbar guide. For model evaluation after smoothing, the mean squared error in Python tutorial is a useful next step.
Handling Missing Values
Pandas rolling windows skip missing values when possible, but the output still depends on min_periods. Decide whether missing values mean unknown data, zeros, or values that should be interpolated before smoothing.
import pandas as pd

values = pd.Series([10, None, 13, 18, None, 19, 25])
smoothed = values.rolling(window=3, min_periods=2).mean()

print(smoothed)
Bad missing-value masks can break data workflows before smoothing. PythonPool's guide to non-boolean masks with NA/NaN values explains one common Pandas error.
Common Mistakes
- Using a centered window for forecasting and accidentally including future data.
- Comparing a shorter NumPy
validresult with the original array without aligning indexes. - Choosing a window that is too large, which hides real changes in the data.
- Filling missing values with zero when zero is not a meaningful measurement.
- Forgetting that a DataFrame workflow may need column selection before rolling calculations.
Use A Simple Window
A convolution gives a compact implementation for evenly sampled data. The valid mode returns only positions with a complete window, so its length is smaller than the input.
import numpy as np

values = np.array([1., 2., 4., 8., 16.])
window = np.ones(3) / 3
smoothed = np.convolve(values, window, mode="valid")
print(smoothed)
Choose Centered Or Trailing
A centered descriptive average uses values before and after the current position. A trailing average uses current and previous values and is safer for online features because it does not look into the future.
values = [10, 12, 14, 16]
window = 2
trailing = []
for index in range(len(values)):
    start = max(0, index - window + 1)
    trailing.append(sum(values[start:index + 1]) / (index - start + 1))
print(trailing)
Use Weighted Windows
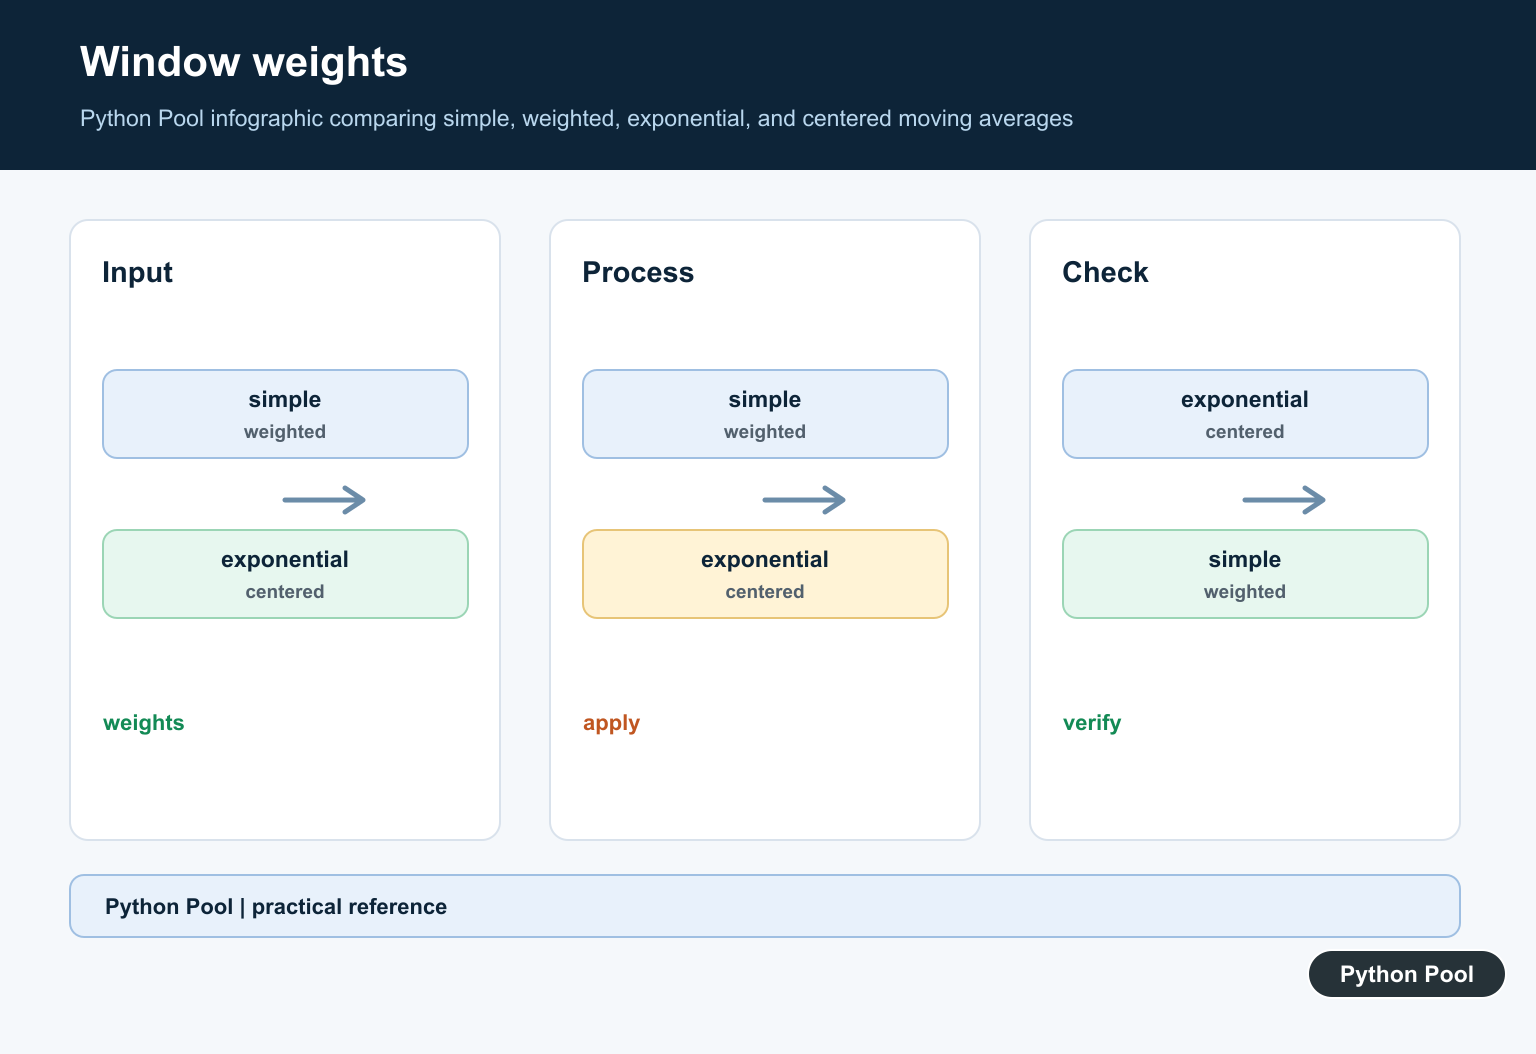
Weights can emphasize recent observations or encode a domain-specific kernel. Normalize them so the output remains on a comparable scale unless a different scale is intentional.
import numpy as np

values = np.array([2., 4., 8.])
weights = np.array([1., 2., 1.])
weights = weights / weights.sum()
print(np.sum(values * weights))
Handle Edges And Missing Values
Padding, dropping incomplete windows, and using a minimum count are different policies. Document the choice and decide whether NaN values should be ignored or invalidate a window.
import numpy as np

values = np.array([1., np.nan, 3.])
if np.isnan(values).any():
    print("missing values need an explicit policy")
For tabular time series, pandas' rolling() API can express window alignment and minimum observations. Related references include gradients, convolution, and array shifts.
For related numerical processing, compare convolution, gradients, and array shifts when defining a window.
Frequently Asked Questions
What is a moving average?
It replaces each value with an average of neighboring values inside a chosen window.
What is the difference between centered and trailing windows?
A centered window uses values on both sides, while a trailing window uses current and past values and is suitable for online forecasting features.
How do I calculate a moving average with NumPy?
Use convolution or cumulative sums for a clear, efficient implementation and define how the output aligns with the input.
Can a moving average use weights?
Yes. A weighted moving average gives different influence to values in the window, but the weights should be normalized and documented.