
Quick answer: np.gradient estimates numerical derivatives from neighboring samples. It works with evenly spaced data or with coordinate spacing supplied explicitly; axis, edge_order, and the spacing units determine whether the result describes the intended physical derivative.
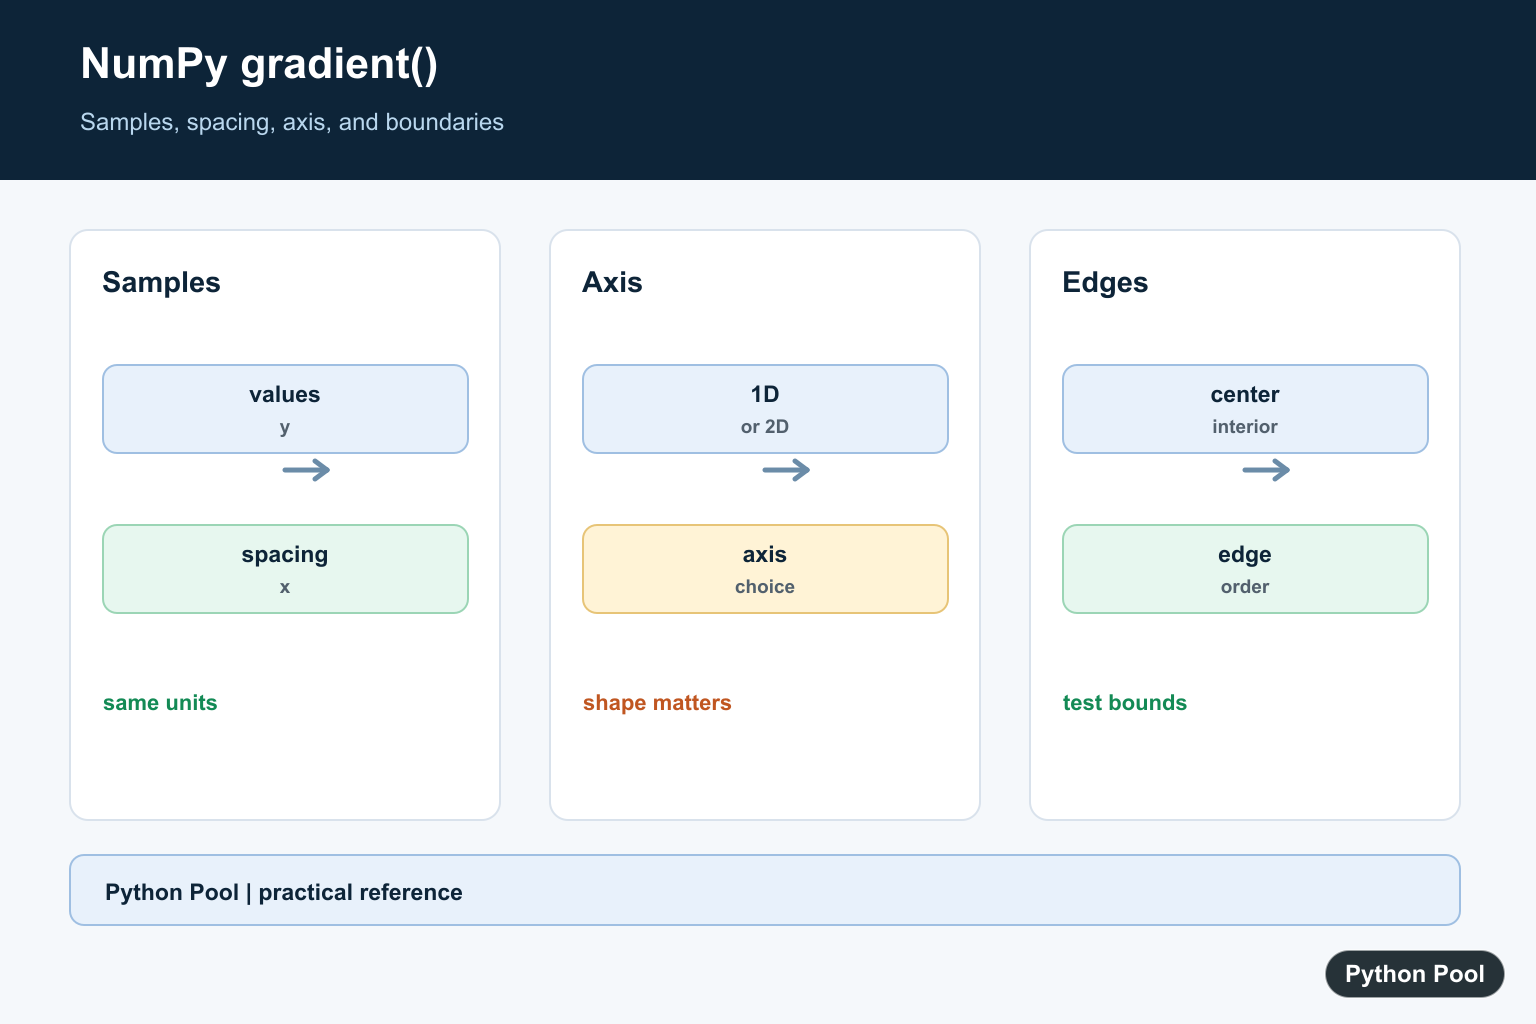
numpy.gradient() estimates the derivative of sampled data. It returns finite-difference approximations with the same shape as the input array.
The official NumPy documentation covers numpy.gradient(), numpy.diff(), and numpy.meshgrid().
Use gradient() when you need a derivative estimate at every sample point. Use diff() when you only need differences between adjacent values and are comfortable with a shorter output.
Spacing matters. If samples are one unit apart, the default spacing is fine. If your x-values use another step size or nonuniform coordinates, pass that spacing so the derivative scale is correct.
For multidimensional arrays, NumPy returns one gradient array for each selected axis. Axis order follows the input shape, so checking shapes is the easiest way to confirm what each returned array means. gradient estimates derivatives while preserving shape; NumPy diff: Calculate Discrete Differences computes exact adjacent differences and explains the shorter output axis.
The edge_order argument controls the finite-difference formula used at boundaries. It can be 1 or 2. Higher edge order can improve boundary estimates, but it requires enough points along the axis.
The output from gradient() is an estimate, not an exact symbolic derivative. It depends on the sampled values, sample spacing, and boundary rule. For noisy data, consider smoothing or validating the derivative estimate before using it in a decision.
For 1D data, the result is one array. For 2D or higher-dimensional data, the default call returns a tuple-like collection with one array per axis. If you only need one direction, use the axis argument.
When coordinates have physical units, include those units in the spacing. A gradient per second, per meter, or per sample can lead to very different numbers.
Estimate A 1D Gradient
The default spacing is one unit between samples.
import numpy as np

values = np.array([1.0, 4.0, 9.0, 16.0])

result = np.gradient(values)

print(result)
The output has the same shape as the input.
Interior points use central differences.
Boundary points use one-sided estimates.
This same-shape behavior is the main difference from diff(), which returns one fewer value along the differenced axis.
Use A Constant Spacing
Pass a scalar spacing when samples are evenly spaced but not one unit apart.
import numpy as np

x = np.array([0.0, 0.5, 1.0, 1.5])
y = x**2

result = np.gradient(y, 0.5)

print(result)
The derivative is scaled by the sample spacing.
Without the spacing argument, the values would be interpreted as one unit apart.
Use this form for regularly sampled measurements.
For example, if samples are collected every half second, passing 0.5 gives a rate per second rather than a rate per sample.
Use Coordinate Spacing
Pass coordinate values when spacing is not uniform.
import numpy as np

x = np.array([0.0, 0.5, 2.0, 4.0])
y = x**2

result = np.gradient(y, x)

print(result)
NumPy uses the coordinate distances between samples.
This is useful for measurements collected at uneven intervals.
The coordinate array must match the length of the axis being differentiated.
Coordinate spacing is a good fit when timestamps or measurement positions are uneven but still ordered.
Find Gradients In 2D
A 2D input returns one gradient for each axis.
import numpy as np

data = np.array([
    [1.0, 2.0, 4.0],
    [3.0, 6.0, 9.0],
])

row_grad, col_grad = np.gradient(data)

print(row_grad)
print(col_grad)
The first output is along axis 0.
The second output is along axis 1.
Both outputs have the same shape as the input data.
Use descriptive names such as row_grad and col_grad so later formulas do not mix the two directions.
Select One Axis
Use axis when only one direction is needed.
import numpy as np

data = np.arange(12, dtype=float).reshape(3, 4)

result = np.gradient(data, axis=1)

print(result)
This estimates changes across columns only.
The result is a single array instead of a list of arrays.
Use axis names consistently in comments and identifiers.
Selecting one axis can also reduce memory use because NumPy does not need to return gradient arrays for every direction.
Axis selection is especially useful for table-like arrays where rows and columns have different meanings. It keeps the derivative estimate focused on the direction that matters.
Use edge_order
edge_order=2 uses a second-order estimate at boundaries.
import numpy as np

values = np.array([0.0, 1.0, 4.0, 9.0, 16.0])

first_order = np.gradient(values, edge_order=1)
second_order = np.gradient(values, edge_order=2)

print(first_order)
print(second_order)
The difference appears at the edges.
Use edge_order=2 only when the axis has enough points.
When the data is short or noisy, compare both edge orders before assuming the second-order boundary estimate is better for the task.
For production calculations, keep a small test case with known slopes. It helps catch spacing mistakes when the data source changes.
In short, use np.gradient() for same-shape derivative estimates, pass spacing when sample intervals matter, select axes deliberately, and choose edge_order based on boundary accuracy needs.
Differentiate Evenly Spaced Data
For evenly spaced samples, pass the sample array and the spacing between points. Keep the spacing in the same units as the independent variable.
import numpy as np

x = np.linspace(0.0, 4.0, 5)
y = x ** 2
dy_dx = np.gradient(y, x[1] - x[0])
print(dy_dx)
Pass Uneven Coordinates
When the samples are not equally spaced, pass the coordinate array rather than assuming a constant step. This prevents the derivative scale from being distorted.
import numpy as np

x = np.array([0.0, 0.5, 2.0, 5.0])
y = x ** 2
print(np.gradient(y, x))
Choose The Axis
For multidimensional arrays, axis selects the dimension being differentiated. Check the shape of the returned result and label the axis in the surrounding code.
import numpy as np

values = np.arange(12.0).reshape(3, 4)
row_change = np.gradient(values, axis=0)
column_change = np.gradient(values, axis=1)
print(row_change.shape, column_change.shape)
Treat Boundaries Deliberately
Interior points use centered differences, while boundaries use one-sided estimates. edge_order changes the boundary approximation when enough samples exist, so test it on a known function.
import numpy as np

x = np.linspace(0.0, 1.0, 6)
y = x ** 3
print(np.gradient(y, x, edge_order=1))
print(np.gradient(y, x, edge_order=2))
NumPy’s gradient() reference documents spacing, axis, and edge order. Related references include binning values, logarithmic samples, and axis selection.
For related NumPy operations, compare axis selection, binning values, and arithmetic ranges when preparing array samples.
Frequently Asked Questions
What does np.gradient return?
It returns numerical derivative estimates using differences between neighboring samples.
Can gradient handle uneven spacing?
Yes. Pass coordinate arrays or spacing values that describe the sample locations.
What does axis control?
axis selects the dimension along which the derivative is calculated; for multidimensional input, each selected axis can produce a separate result.
What does edge_order change?
It selects the order of the finite-difference estimate at the boundaries, when enough samples are available.