Quick answer: np.median computes the middle of sorted values, averaging the two middle values for an even-sized group. Use axis to choose groups, keepdims to preserve broadcastable dimensions, and nanmedian only when ignoring missing values is the correct data policy.
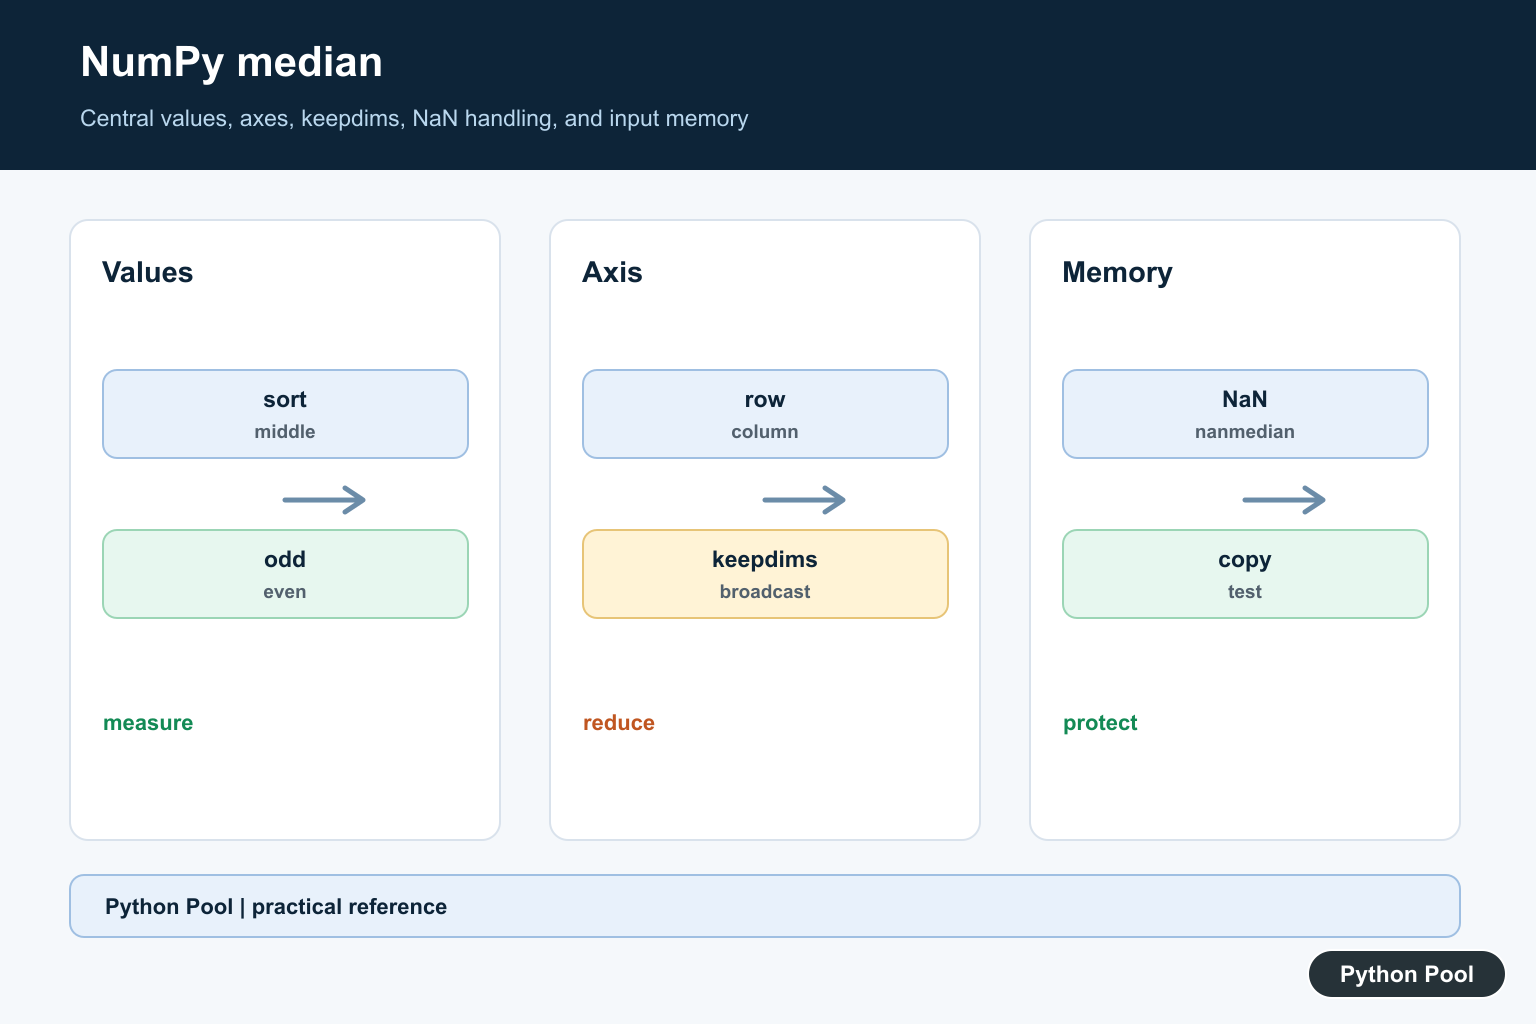
numpy.median() calculates the median of array values. The median is the central value after the data is ordered.
The official NumPy documentation covers numpy.median(), numpy.nanmedian(), and numpy.mean().
The median is useful when extreme values should not dominate the summary. It is common in reports, quality checks, latency analysis, finance examples, and exploratory data analysis.
For an odd number of values, the median is the middle value. For an even number of values, NumPy averages the two middle values.
The most important option is axis. Without an axis, NumPy flattens the array and returns one median. With an axis, it calculates separate medians across rows or columns.
Before choosing median, decide what kind of central summary you need. The median is resistant to extreme values, while the mean moves more when a very large or very small value appears in the data.
That makes the median useful for skewed data such as response times, prices, file sizes, and counts where a few large values can distort the average.
Median Of Odd-Length Data
For an odd number of values, the median is the middle value after sorting.
import numpy as np

data = np.array([9, 1, 5, 3, 7])

result = np.median(data)

print(result)
This prints 5.0.
The input does not need to be sorted first. NumPy handles the ordering internally.
Use this form when you need one central summary for a one-dimensional array.
Even when the data is already sorted, calling np.median() keeps the intent clear. The function documents that the result is a median, not just a manually selected middle item.
Median Of Even-Length Data
For an even number of values, NumPy averages the two middle values.
import numpy as np

data = np.array([10, 20, 30, 40])

result = np.median(data)

print(result)
This prints 25.0.
The result can be a float even when the input contains integers because the average of the two middle values may not be an integer.
This behavior is expected and is usually what you want for a median summary.
Median Down Columns
Use axis=0 to calculate medians down each column.
import numpy as np

data = np.array([
    [10, 80],
    [20, 85],
    [30, 90],
])

result = np.median(data, axis=0)

print(result)
Each column receives its own median.
This is useful when columns represent separate metrics or features.
Column medians are often used to summarize table-like arrays without mixing unrelated measurements together.
For dashboards and reports, column medians are easier to explain when each column has a clear label. Keep the array layout documented so the median output maps back to the right metric.
Median Across Rows
Use axis=1 to calculate a median for each row.
import numpy as np

data = np.array([
    [10, 20, 30],
    [40, 50, 60],
])

result = np.median(data, axis=1)

print(result)
Each row receives its own median.
This is useful when each row is a record and the columns are repeated measurements for that record.
Check the shape before choosing an axis. The wrong axis can return plausible numbers that summarize the wrong direction.
A simple shape print during debugging can save time. If the array shape is (rows, columns), axis=0 summarizes each column and axis=1 summarizes each row. The median is the 0.5 quantile; NumPy quantile() Function Guide generalizes that idea to arbitrary ranks, axes, and methods.
Keep Dimensions
Use keepdims=True when the result should keep reduced dimensions with size one.
import numpy as np

data = np.array([
    [10, 20, 30],
    [40, 50, 60],
])

result = np.median(data, axis=1, keepdims=True)

print(result)
print(result.shape)
This can make later broadcasting easier because the row dimension is preserved.
keepdims is helpful in array math pipelines where the median is subtracted from the original array or combined with another array of compatible shape.
For simple display output, the default shape is usually easier to read.
Ignore NaN Values
Use np.nanmedian() when missing values are represented by nan and should be ignored.
import numpy as np

data = np.array([10, 20, np.nan, 40])

result = np.nanmedian(data)

print(result)
This calculates the median from the non-NaN values.
Only skip missing values when that matches the data rule for the project. In some workflows, missing values should be rejected or filled before summary statistics are calculated.
Document the choice in reports so the median can be reproduced later.
Common median Mistakes
The first common mistake is confusing median and mean. The mean is the arithmetic average, while the median is the central ordered value.
The second mistake is forgetting that np.median() flattens the input when axis is omitted. Use an axis for per-row or per-column summaries.
The third mistake is ignoring missing values without making that rule explicit. np.nanmedian() is useful, but it changes the data rule.
In short, use np.median(data) for one central summary, choose axis=0 or axis=1 for column or row medians, and use np.nanmedian() only when missing values should be skipped.
Understand The Statistical Meaning
Median is an order statistic and is less sensitive to extreme values than the mean. It still describes the selected sample, so axis and preprocessing must match the question being asked.
Reduce Along An Axis
axis=None flattens the input. axis=0 summarizes each column, while axis=1 summarizes each row for a two-dimensional array. Assert the output shape when integrating with later calculations.
Preserve Dimensions When Needed
keepdims=True retains singleton dimensions for reduced axes. This is useful when subtracting a row or column median from the original array with broadcasting.
Choose A NaN Policy
np.median can return NaN when missing values participate. np.nanmedian ignores NaNs, but an all-NaN slice still needs an explicit interpretation and may produce a warning.
Protect The Input
The default calculation does not intentionally overwrite the input. overwrite_input=True may reuse its memory and partially reorder it, so use it only when the original array is disposable.
Test Odd And Even Samples
Test odd and even counts, axis reductions, integers, floats, NaNs, and singleton dimensions. Compare a small result with a manually sorted fixture to catch an axis mistake.
The official NumPy median reference documents axis, keepdims, and overwrite_input. Related Python Pool references include arrays and tests.
For related statistical reductions, compare array axes, fixture tests, and minimum reductions when summarizing data.
Frequently Asked Questions
What does np.median return?
np.median returns the median of an array or the median along a selected axis.
How is the median calculated for an even number of values?
After ordering the values, NumPy averages the two middle values.
How do I ignore NaN values when calculating a median?
Use np.nanmedian when NaN values represent missing data that should be excluded, and document the missing-data policy.
What does overwrite_input=True do?
It allows the median calculation to reuse and modify the input array, which can reduce memory use but means the input contents should no longer be trusted.