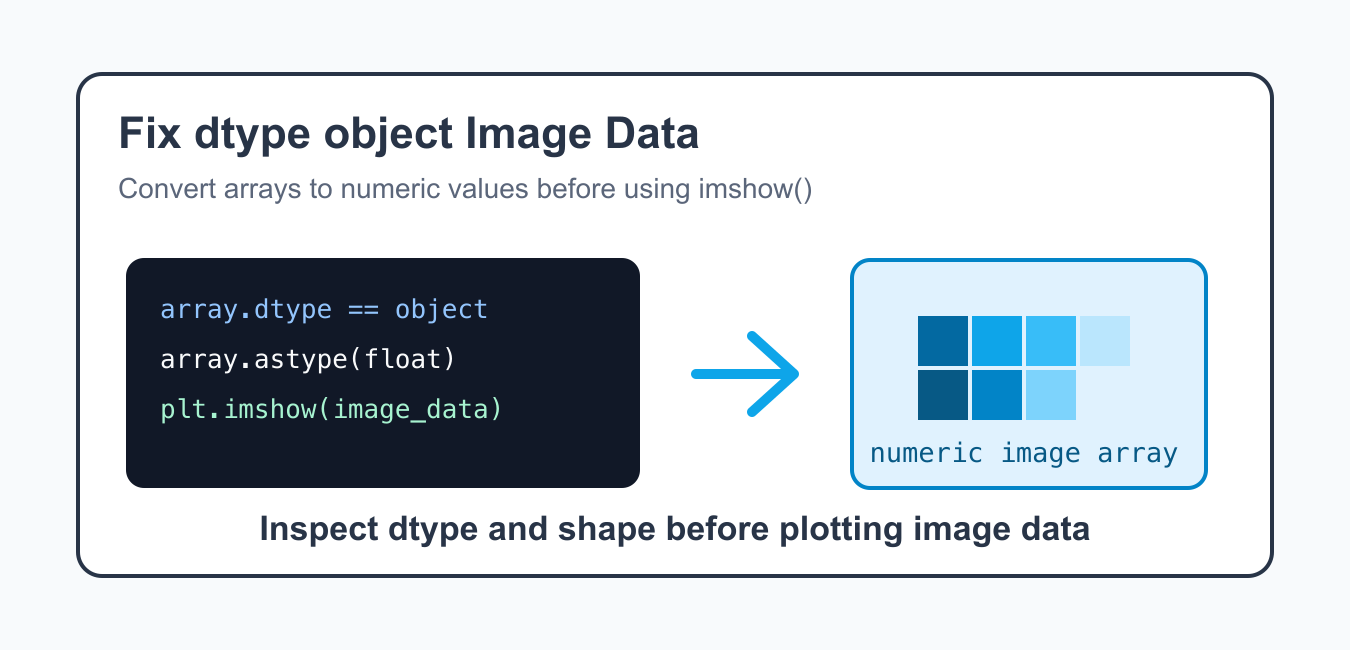
Quick Answer
Inspect dtype, shape, and sample values first. Convert numeric object data with np.asarray(data, dtype=float), handle None or NaN explicitly, and ensure imshow() receives a 2D scalar array or a 3D RGB/RGBA numeric array.
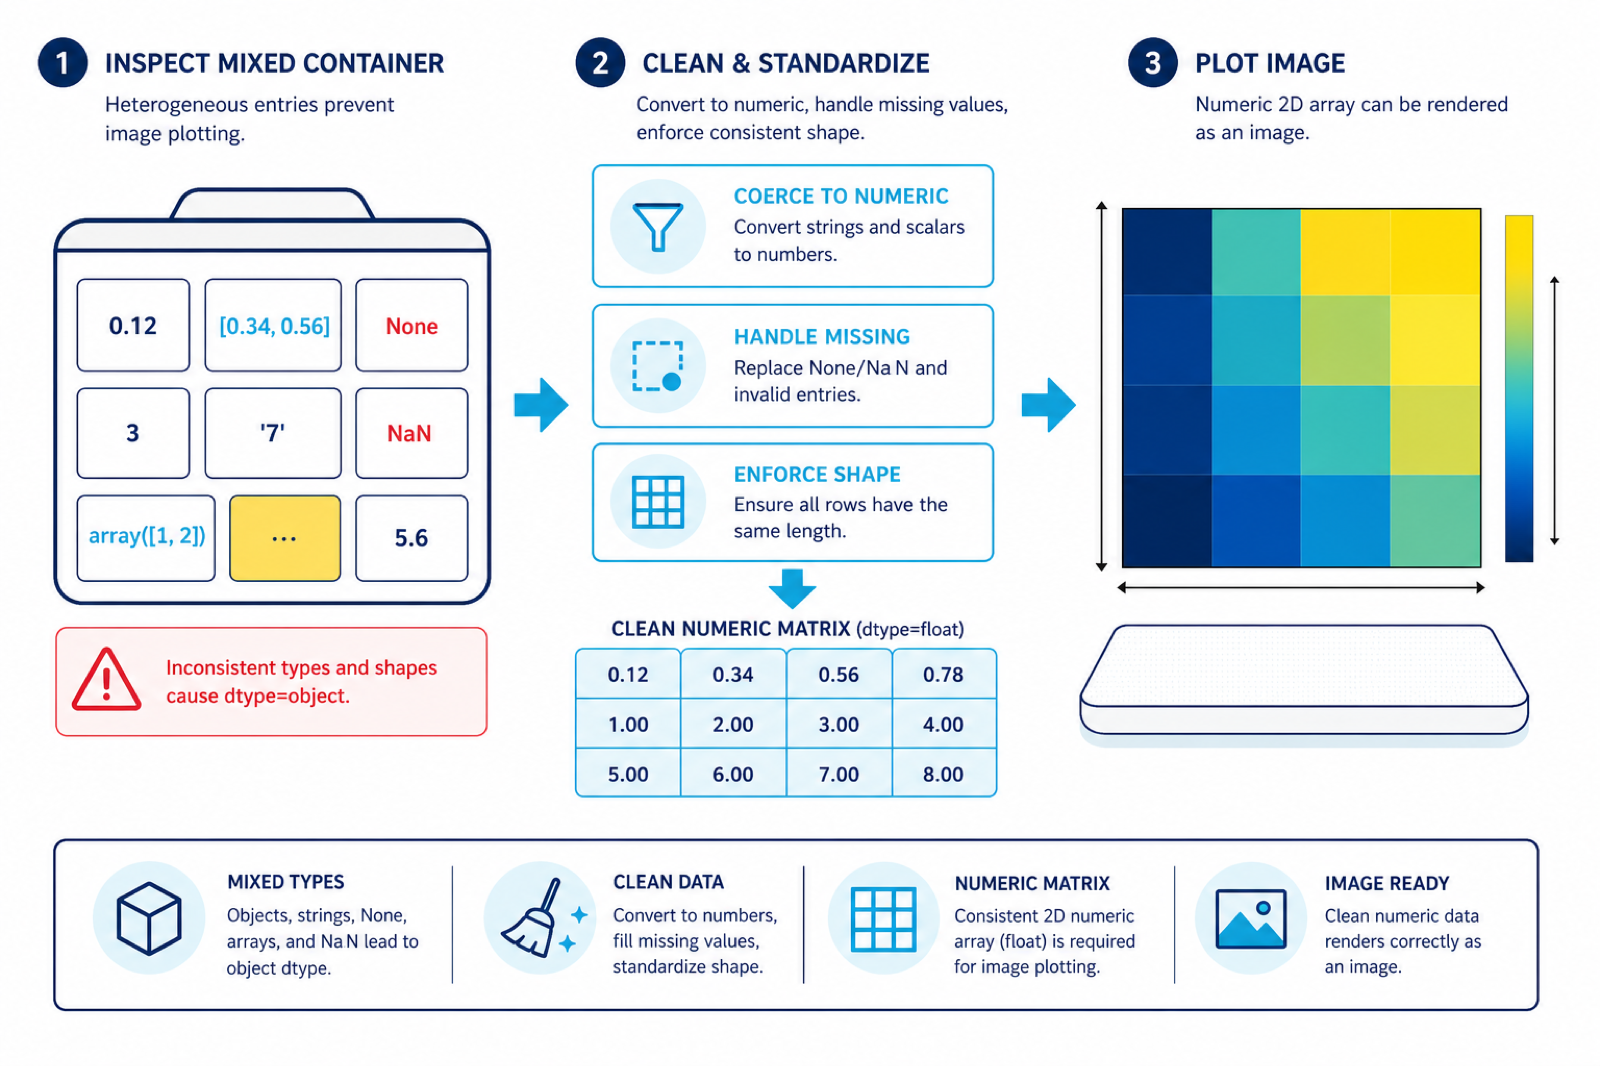
The error image data of dtype object cannot be converted to float usually appears when Matplotlib receives an array that looks like image data but has dtype object. Image display functions such as imshow() expect numeric arrays or valid image-like input, not arrays filled with mixed Python objects.
The common causes are nested lists with inconsistent lengths, arrays containing strings, arrays containing PIL images instead of pixels, or pandas data that was converted to NumPy without cleaning. The fix is to inspect the input, convert it to a numeric array, and make sure the shape matches what image plotting expects.
This error is a data-shape and dtype problem, not a Matplotlib styling problem. Changing the colormap, figure size, or axis settings will not help if the array itself contains Python objects. Fix the data before changing the plot.
Use the official Matplotlib imshow documentation, NumPy asarray documentation, NumPy dtype documentation, and Pillow Image documentation as primary references.
Inspect dtype And Shape
Start by printing the array dtype, shape, and a small sample. This tells you whether Matplotlib is receiving numeric data.
import numpy as np

data = np.array([[1, 2], [3, 4]], dtype=object)

print(data.dtype)
print(data.shape)
print(data[:2, :2])
If the dtype is object, look inside the values. The array may contain strings, lists, None values, PIL objects, or mixed types.
Also inspect the shape. A valid heatmap is usually a 2D numeric array, while a color image is usually a 3D numeric array with three or four channels. A one-dimensional object array is a sign that NumPy could not form the expected grid.
Convert Numeric Object Arrays
If the values are numeric but stored as objects, convert the array to a numeric dtype before plotting.
import numpy as np

data = np.array([["1.0", "2.5"], ["3.0", "4.5"]], dtype=object)
numeric = data.astype(float)

print(numeric.dtype)
print(numeric)
This works only when every value can be converted. If one value is text such as "missing", clean or replace it before conversion.
Do not call astype(float) blindly on production data. If conversion fails, print or log the values that cannot be converted so the data source can be corrected.
Fix Ragged Nested Lists
Ragged lists have rows with different lengths. They cannot form a normal 2D numeric image array.
rows = [
    [1, 2, 3],
    [4, 5, 6],
    [7, 8, 9],
]

array = np.asarray(rows, dtype=float)

print(array.shape)
print(array.dtype)
If your rows have different lengths, pad, crop, or rebuild the data before plotting. A valid grayscale image array should have a rectangular 2D shape.
Ragged rows often come from manual list building, parsed files, or inconsistent preprocessing. Fix the row lengths where the data is created, because later plotting code cannot know how missing cells should be handled.
Convert A PIL Image To Pixels
Do not wrap a PIL image object inside an object array. Convert the image itself to a NumPy array of pixel values.
from PIL import Image
import numpy as np

image = Image.new("RGB", (3, 2), color="navy")
pixels = np.asarray(image)

print(pixels.shape)
print(pixels.dtype)
An RGB image usually has shape (height, width, 3). Matplotlib can display that numeric array directly with imshow().
If you have a list of image objects, convert each image separately or build a batch with a consistent shape. A list of different-sized images will often become an object array instead of a numeric batch.
Display A Clean Array
Once the dtype and shape are correct, pass the numeric array to imshow().
import matplotlib.pyplot as plt
import numpy as np

image_data = np.array([
    [0.1, 0.3, 0.5],
    [0.4, 0.7, 0.9],
], dtype=float)

plt.imshow(image_data, cmap="viridis")
plt.colorbar()
plt.show()
For grayscale or heatmap-style data, a 2D numeric array is enough. For color images, use a 3D array with color channels.
If values are outside the expected image range, Matplotlib may warn or clip the data. That is a separate issue from dtype object conversion. First make the array numeric, then handle scaling or normalization.
Clean Missing Values
If object dtype comes from mixed data with missing values, convert carefully and replace invalid entries.
import numpy as np

data = np.array([["1", "2"], ["", "4"]], dtype=object)
cleaned = np.where(data == "", np.nan, data).astype(float)

print(cleaned)
print(np.nanmean(cleaned))
Decide whether missing pixels should become NaN, zero, a mask, or a filled value. The right choice depends on the image or heatmap meaning.
For scientific heatmaps, preserving missing values as NaN can be more honest than filling them with zero. For generated image pixels, a fill value may be appropriate if the missing value means background.
Practical Checklist
Check dtype, shape, and a sample of values before plotting. Convert numeric strings to floats, rebuild ragged lists, convert PIL images to arrays, and clean missing values deliberately. Do not pass arrays of arbitrary Python objects to imshow().
When the input comes from pandas, check the column dtypes before converting to NumPy. A single text value in an otherwise numeric table can force object dtype and cause the image display step to fail later.
The reliable pattern is to make the array rectangular, numeric, and shaped for the image type you want to display. Once the data is a real NumPy numeric array, Matplotlib can render it without the dtype object conversion error.
Validate Both Dtype and Shape
Changing the colormap cannot repair an object array. First decide whether the data is a grayscale matrix, an RGB image, or a collection of unrelated Python objects. Then convert and validate it before plotting.
import numpy as np
import matplotlib.pyplot as plt

raw = [[1, 2], [3, 4]]
image = np.asarray(raw, dtype=float)
if image.ndim != 2 or not np.isfinite(image).all():
    raise ValueError('expected a finite 2D numeric image')
plt.imshow(image, cmap='gray')
plt.show()
If the source is a pandas column, nested list, or collection of image objects, normalize that source first. A numeric dtype alone is not enough if the dimensions do not represent image pixels.
For adjacent image-array workflows, compare Matplotlib imshow() and converting a PIL image to a NumPy array.
Frequently Asked Questions
Why does imshow() reject dtype object?
An object array can contain strings, None, nested arrays, or unrelated Python objects. Matplotlib needs numeric image data with a supported shape and values.
How do I convert numeric object data?
Use np.asarray(data, dtype=float) after confirming that every value is numeric and that missing values have a documented policy.
What shape does imshow() expect?
A grayscale image is commonly 2D. RGB and RGBA images are commonly 3D arrays whose last dimension has three or four channels.
Why does changing cmap not fix this error?
The failure occurs before color mapping because Matplotlib cannot convert the input data into numeric image values. Clean dtype and shape first.