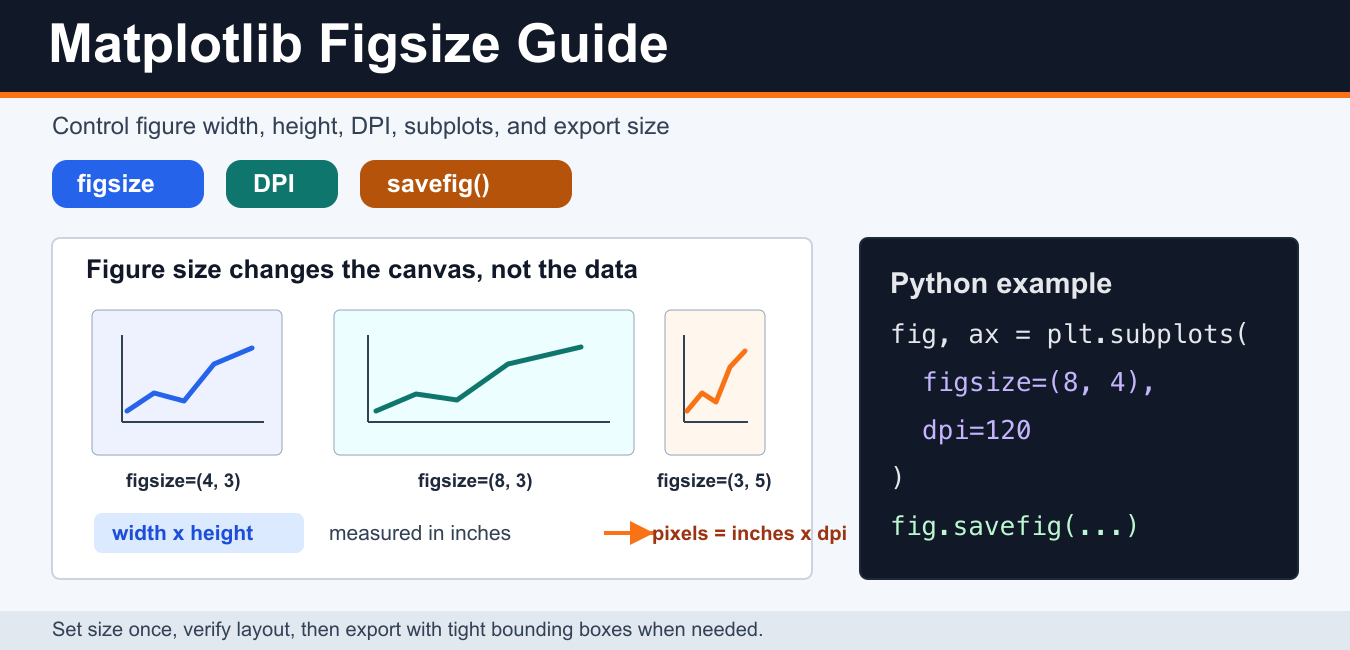
Matplotlib figsize controls a figure’s physical width and height in inches. The final raster dimensions depend on both that size and the dots-per-inch value: pixels are approximately inches multiplied by DPI. Set the canvas before tuning labels, legends, and subplot spacing so the layout decisions match the output you intend to publish.
Quick answer
Use plt.figure(figsize=(width, height)) or plt.subplots(figsize=(width, height), dpi=...). The tuple is width first and height second, and the units are inches rather than pixels. The official figure API documents figsize and dpi; Matplotlib’s figure-size guide explains unit conversion.
Set figsize with figure()
For one simple axes, pass figsize to plt.figure(). The first value is the width, and the second is the height.
import matplotlib.pyplot as plt

months = ["Jan", "Feb", "Mar", "Apr"]
values = [12, 18, 16, 23]

plt.figure(figsize=(8, 4))
plt.plot(months, values, marker="o")
plt.title("Monthly values")
plt.xlabel("Month")
plt.ylabel("Value")
plt.show()
An eight-by-four figure has a two-to-one aspect ratio before the axes, labels, and margins are laid out. Changing the figure size changes available space, not the underlying data coordinates.
Use figsize with subplots()
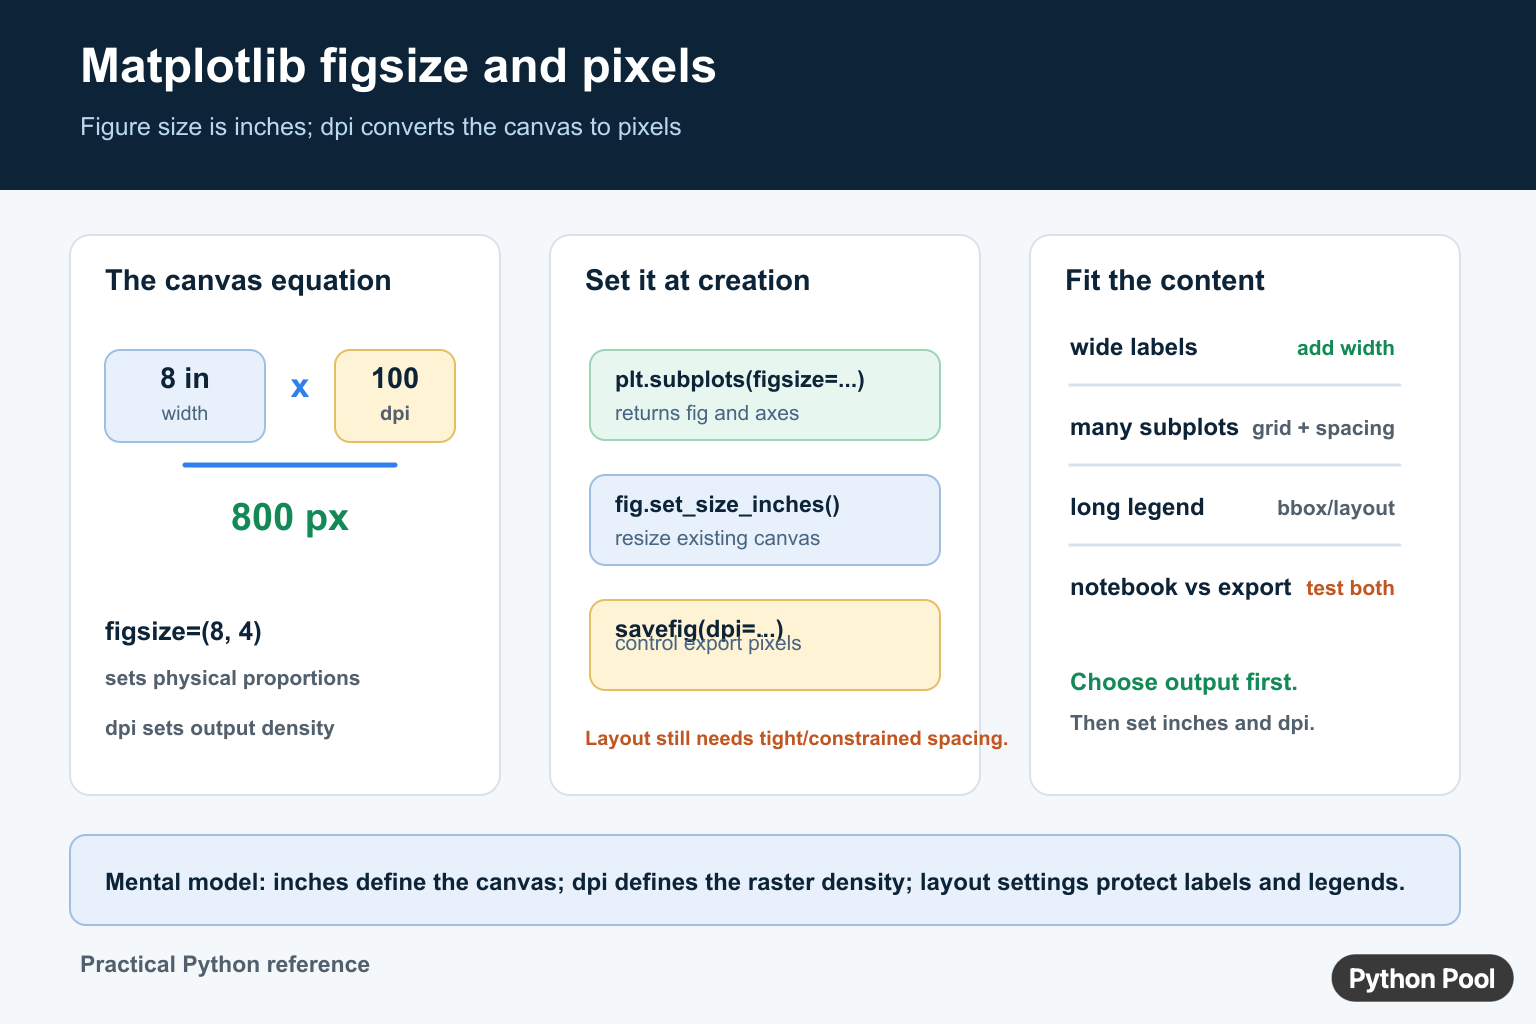
The object-oriented API is usually easier to maintain because it returns both the figure and axes. Set the size at creation and apply layout settings to the figure.
import matplotlib.pyplot as plt

fig, axes = plt.subplots(2, 1, figsize=(8, 6), dpi=120)
axes[0].plot([1, 2, 3], [2, 4, 3])
axes[1].plot([1, 2, 3], [1, 3, 5])
fig.tight_layout()
plt.show()
For complex grids, constrained_layout=True can manage many decorations, but inspect the exported result rather than assuming any automatic layout is perfect.
Understand inches, DPI, and pixels
If a figure is eight inches wide at 100 DPI, its nominal raster width is 800 pixels. Increasing DPI makes the exported image denser without changing the physical inch dimensions. A notebook backend may display a scaled version, so the visible browser size is not always the file’s pixel size.
import matplotlib.pyplot as plt

fig, axis = plt.subplots(figsize=(8, 4), dpi=100)
print(fig.get_size_inches())
print(fig.dpi)
fig.savefig("chart.png", dpi=200)
The DPI supplied to savefig() can override the figure’s display DPI for the saved file. Choose it together with the target format, file size, and the smallest text that must remain readable.
Resize an existing figure
Call fig.set_size_inches(width, height) when the figure already exists and the output target changes. Avoid repeatedly resizing in different parts of a plotting function because later calls can make layout behavior difficult to predict.
import matplotlib.pyplot as plt

fig, axis = plt.subplots()
axis.plot([1, 2, 3], [2, 3, 5])
fig.set_size_inches(7, 3.5)
fig.savefig("wide-chart.png", dpi=150)
Protect labels and legends
A larger canvas does not automatically guarantee usable spacing. Long tick labels, rotated dates, legends, and multiple subplots all consume margins. Use tight_layout(), constrained layout, or explicit margins, and verify the saved file at the same dimensions used by the report.
bbox_inches="tight" can crop the saved bounding box around visible artists, which is useful for some exports but may produce dimensions different from the nominal canvas. Decide whether exact pixel dimensions or tight content bounds are the stronger requirement.
Choose the size from the output
Use a wider figure for tables, long labels, and multiple columns; use a taller figure when rows or annotations need vertical room. For a social preview or documentation image, start from the required pixel ratio, choose a DPI, and derive the inch dimensions instead of trial-and-error resizing after the plot is complete.
For related chart layout, see Matplotlib imshow() and fixing legend handles.
Control defaults with rcParams
If every figure in a project should follow one standard, set the default figure size and DPI through Matplotlib configuration rather than repeating literals in every plotting function. Local arguments still override the defaults for an individual chart.
import matplotlib.pyplot as plt

plt.rcParams["figure.figsize"] = (7, 4)
plt.rcParams["figure.dpi"] = 110

fig, axis = plt.subplots()
axis.plot([1, 2, 3], [1, 4, 2])
Keep global configuration near the application entry point. A hidden setting in a notebook or imported module can make two otherwise identical plots render at different sizes.
Separate canvas size from axes aspect
figsize changes the figure canvas. It does not force the data region to be square or preserve equal units on the x and y axes. For image-like data, use an axes aspect setting; for ordinary charts, choose the canvas ratio that gives labels enough room.
Changing figsize is not a substitute for fixing clipped tick labels or a legend. Layout tools and explicit margins solve spacing, while the canvas size determines how much space is available to those tools.
Verify the saved artifact
Inspect the actual PNG, PDF, or SVG produced by savefig(). A notebook preview can hide clipping that appears in a file, and a tight bounding box can change the final raster dimensions. Automated reports should assert the expected width, height, and readable text for representative figures.
Choose a stable aspect ratio
Keep a consistent ratio for a family of report figures so readers can compare them without the page jumping between shapes. Change the ratio only when the data or labels genuinely need the extra width or height.
Record the chosen ratio with the report template rather than hiding it in an individual notebook cell.
For accessible reports, reserve enough physical height for titles, tick labels, and annotations instead of shrinking their font until they technically fit. The best figsize is the one that keeps the data and its explanation readable at the final viewing scale.
Before changing font sizes, try increasing the canvas or reducing unnecessary decoration. This preserves the hierarchy of the chart and makes the output easier to scan on both a monitor and a printed page.
Save one representative export during testing and review it at final size.
Frequently Asked Questions
What units does Matplotlib figsize use?
figsize uses inches as (width, height); DPI then determines the approximate pixel dimensions of a raster export.
How do I set figsize in Matplotlib?
Pass figsize=(width, height) to plt.figure() or plt.subplots(), or resize an existing figure with set_size_inches().
How do I convert figsize to pixels?
Multiply each inch dimension by the relevant DPI, such as 8 inches at 100 DPI producing about 800 pixels.
Why are labels clipped even with a larger figsize?
A larger canvas provides room but does not guarantee spacing; use tight_layout(), constrained layout, or explicit margins and inspect the export.
Your work is Superb mate to teach people, thanks for sharing it,