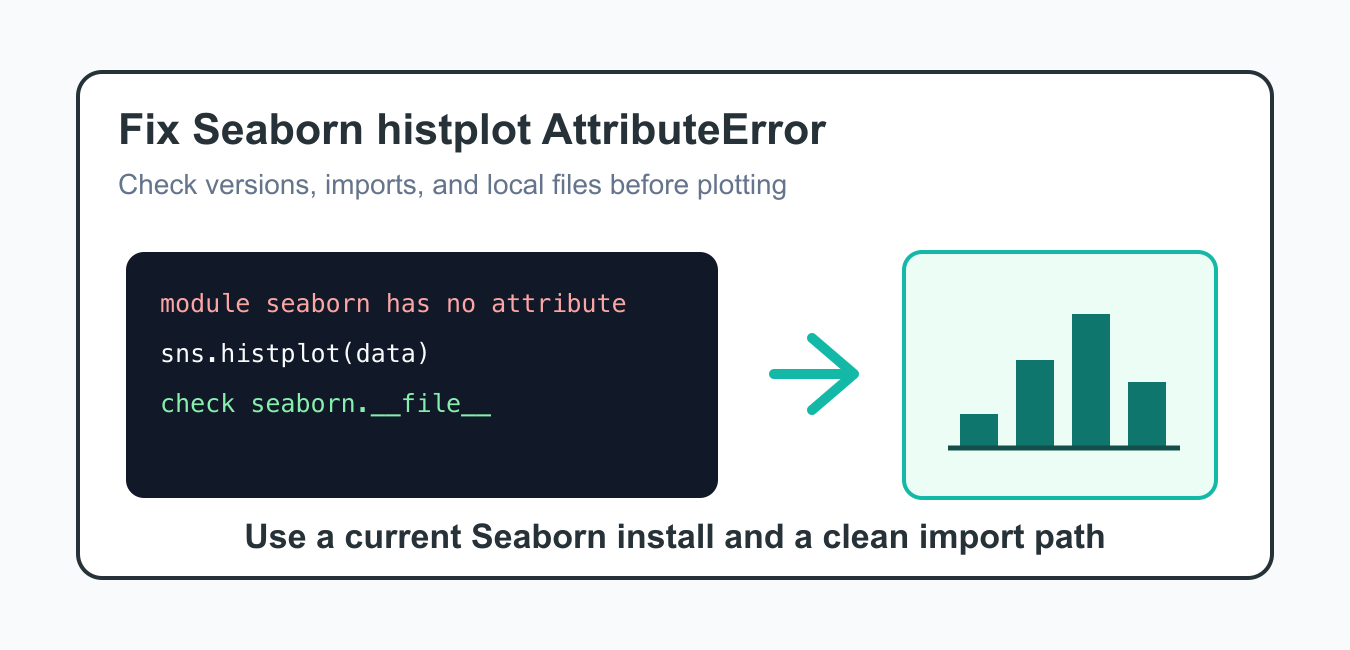
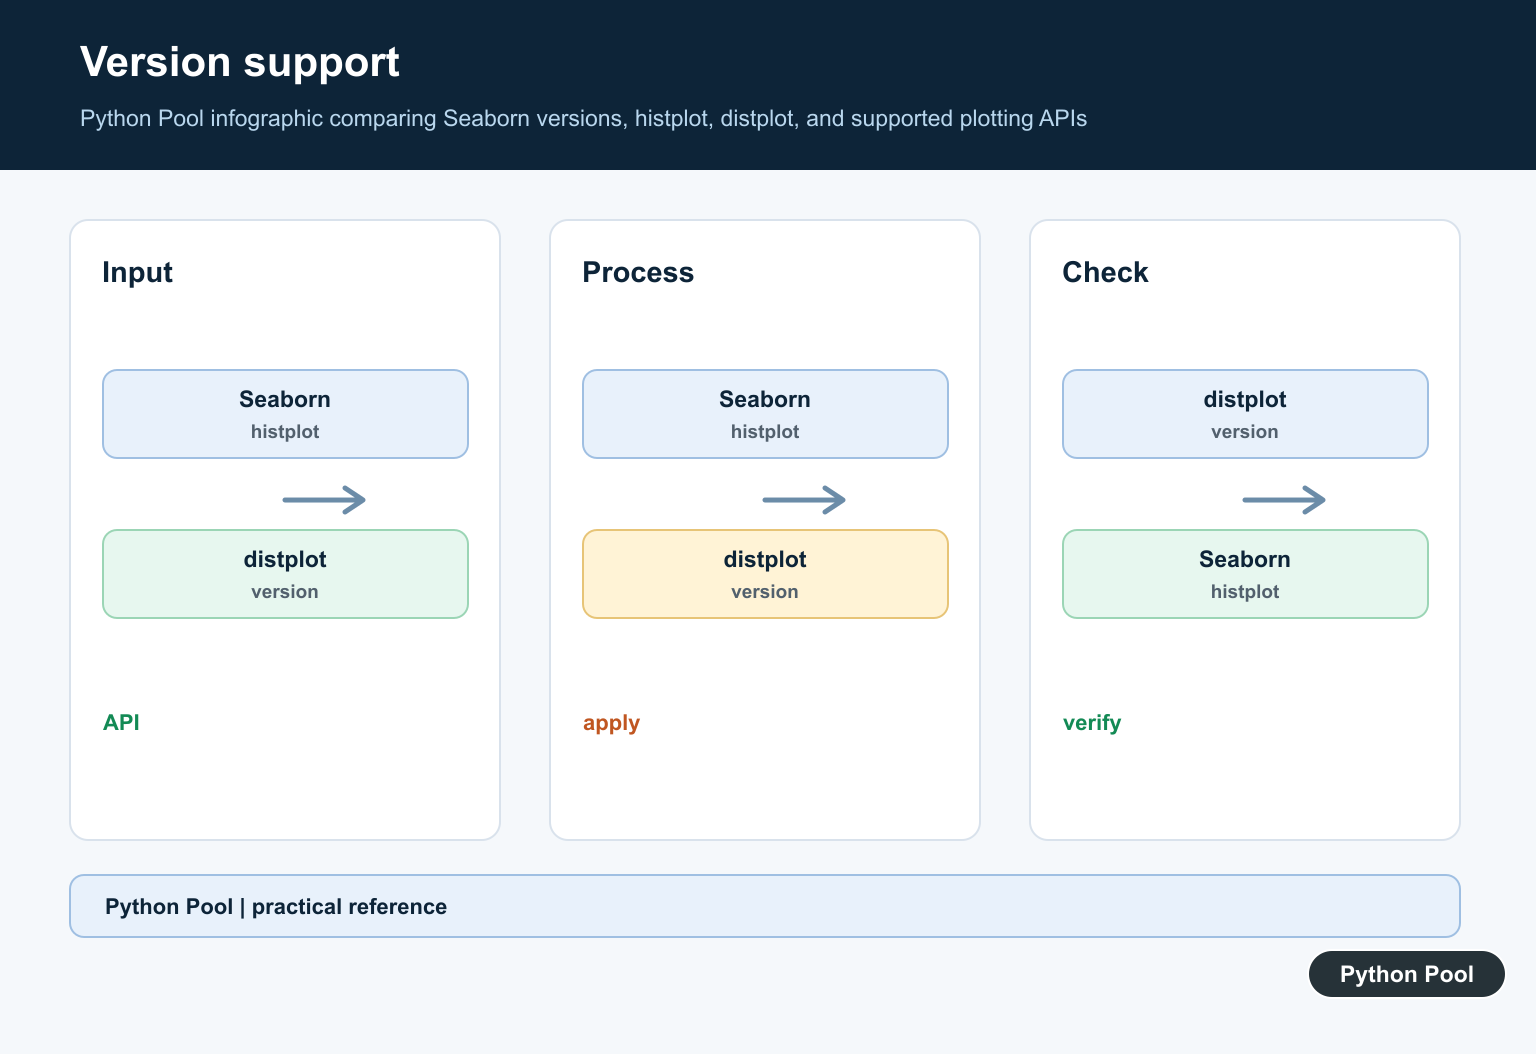
Quick answer: Seaborn has no attribute histplot usually means the running interpreter loaded an older Seaborn release, imported a local module that shadows the real package, or is different from the environment where Seaborn was upgraded. Check seaborn.__version__ and seaborn.__file__ inside the failing process, then upgrade or pin the package there. histplot is the supported modern replacement for the deprecated distplot API.
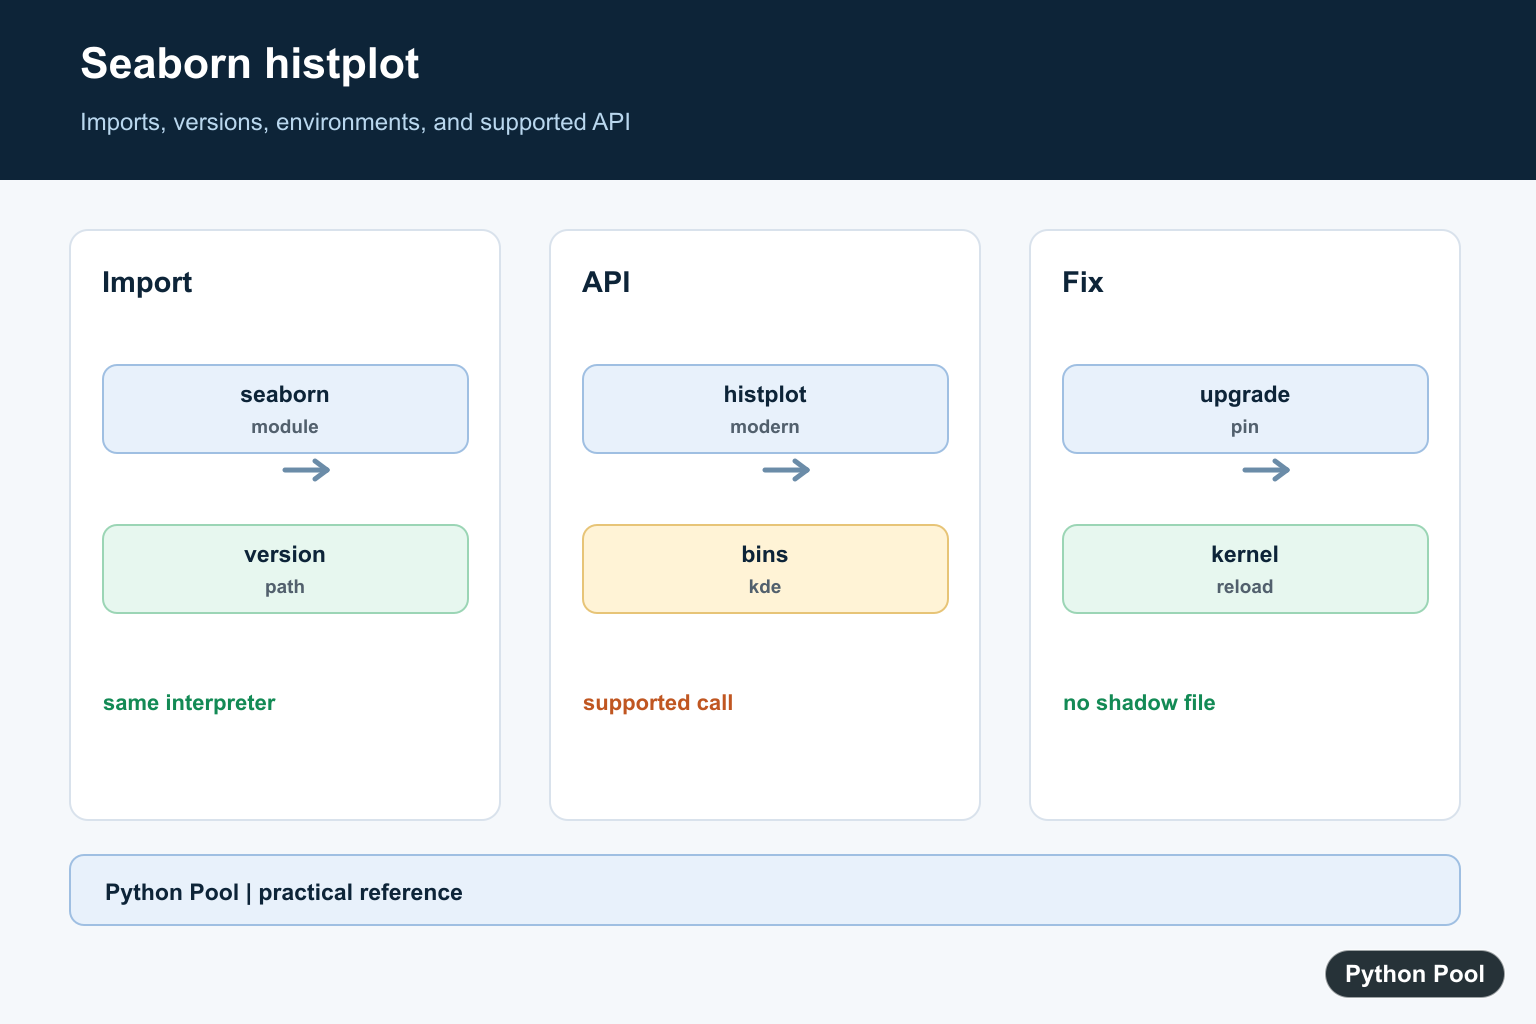
The error module seaborn has no attribute histplot means the imported seaborn module does not expose histplot in the current runtime. The usual causes are an old Seaborn version, a local file named seaborn.py, a stale notebook kernel, or code running in a different Python environment than the one you upgraded.
sns.histplot() is the modern Seaborn function for histogram-style distribution plots. If the attribute is missing, do not change the plot call first. Confirm which Seaborn package Python imported and which version is loaded.
Notebook users should be especially careful. Installing a package in one terminal does not update an already-running kernel. Restart the kernel after upgrades and check seaborn.__file__ from inside the notebook.
This error can also appear after copying code between projects. One project may use a current Seaborn release, while another project uses an older locked environment. The same notebook cell can therefore work in one place and fail in another. Treat the runtime as part of the bug.
The official Seaborn histplot documentation, Seaborn installation guide, Seaborn release notes, Seaborn distribution tutorial, and Matplotlib hist documentation are useful references.
Check The Loaded Seaborn Version
Start by printing the Seaborn version from the same runtime that raises the error.
import seaborn as sns

print(sns.__version__)
print(sns.__file__)
print(hasattr(sns, "histplot"))
If hasattr() returns False, the runtime is not using a Seaborn build that exposes histplot, or it is importing something that is not the real package.
The file path is as important as the version. If sns.__file__ points to your working directory, Python imported a local file instead of the installed Seaborn package.
Check Package Metadata
Use importlib.metadata to inspect installed package versions without depending on package-specific attributes.
from importlib.metadata import PackageNotFoundError, version

for package in ["seaborn", "matplotlib", "pandas"]:
    try:
        print(package, version(package))
    except PackageNotFoundError:
        print(package, "not installed")
Run this in the same notebook kernel, script runner, or application worker where the error appears. Version checks from a different environment can be misleading.
If the metadata command shows a modern version but hasattr() is still false, restart the process and check for shadowing. A stale import can remain in memory until the runtime is restarted.
Look For Local Shadowing
A file named seaborn.py or a folder named seaborn in your project can shadow the real package.
from pathlib import Path

project_root = Path.cwd()
for path in [project_root / "seaborn.py", project_root / "seaborn"]:
    if path.exists():
        print("possible shadow:", path)
If you find a local conflict, rename it and remove stale __pycache__ files. Then restart the Python process before trying the import again.
Use histplot With A Current Import
Once the import path and version are correct, use sns.histplot() directly.
import seaborn as sns

values = [2, 3, 3, 4, 5, 7, 8, 8, 9]
axis = sns.histplot(values, bins=4, kde=False)

axis.set_title("Value distribution")
This is the preferred Seaborn call for histogram plots in current code. Add kde=True only when you want a density curve over the bars.
Keep the minimal example small while debugging. Once it works, move back to your real DataFrame, column names, hue settings, and figure styling.
Use Matplotlib As A Temporary Fallback
If you cannot upgrade Seaborn immediately, Matplotlib can draw a plain histogram while you fix the environment.
import matplotlib.pyplot as plt

values = [2, 3, 3, 4, 5, 7, 8, 8, 9]
figure, axis = plt.subplots()
axis.hist(values, bins=4)
axis.set_title("Value distribution")
This fallback keeps the analysis moving, but it does not solve the Seaborn import problem. Treat it as a short-term workaround.
Use the fallback when a report must be produced immediately. Then schedule the package cleanup so the project does not keep two plotting styles for the same chart.
Print The Upgrade Command For The Active Python
When upgrading, target the interpreter that runs your code. Printing the command first helps avoid installing into the wrong environment.
import shlex
import sys

command = [sys.executable, "-m", "pip", "install", "--upgrade", "seaborn"]
print(" ".join(shlex.quote(part) for part in command))
Run the printed command in the intended environment, then restart the runtime and repeat the import checks.
Fix Checklist
First, print sns.__version__, sns.__file__, and hasattr(sns, "histplot"). If the path points to your project folder, fix local shadowing. If the version is old, upgrade Seaborn in the active environment.
Next, restart notebooks, application workers, and terminals after upgrading. A running process can keep the old import in memory until it restarts.
Finally, test a minimal sns.histplot() call before returning to the full analysis. That separates package/import issues from dataset-specific plotting problems.
Document the final package versions after the fix. That makes future notebook reruns and deployment rebuilds easier to reproduce. Keep that note with the project setup instructions for every analysis environment.
Inspect The Running Import
Do not diagnose this from a different terminal environment. Print the module version and file path from the same script, notebook kernel, or service that raises the error. A local seaborn.py file can also shadow the installed package.
import seaborn as sns

print(sns.__version__)
print(sns.__file__)
Use histplot In A Modern Environment
histplot accepts a data source and column names or an array-like series. Keep the plot call small while testing the import, then add hue, bins, and a statistical estimate after the base chart works.
import matplotlib.pyplot as plt
import seaborn as sns

values = [1, 2, 2, 3, 3, 3, 4]
sns.histplot(values, bins=4, kde=False)
plt.xlabel("value")
plt.tight_layout()
Upgrade The Correct Interpreter
Use the interpreter that will execute the program to install or upgrade Seaborn. python -m pip avoids a common mismatch where pip modifies one environment while python imports another.
import subprocess
import sys

subprocess.run([sys.executable, "-m", "pip", "install", "--upgrade", "seaborn"], check=True)
Handle Legacy Compatibility Deliberately
If a project must support an older pinned environment, use the API available in that version or isolate a compatibility branch. Do not silently switch between histplot and deprecated calls without recording which behavior and bins the result uses.
import seaborn as sns

values = [1, 2, 2, 3]
if hasattr(sns, "histplot"):
    plot = sns.histplot(values)
else:
    raise RuntimeError("Install a Seaborn version that provides histplot")
print(plot)
Seaborn documents histplot() and its current plotting parameters. Python’s sys.executable helps identify the active interpreter. Related references include visualization workflows, NumPy histograms, and 2D histograms.
For related distribution plots, compare visualization workflows, NumPy histograms, and 2D histograms after confirming the active Seaborn environment.
Frequently Asked Questions
Why does Seaborn have no attribute histplot?
The running environment may have an older Seaborn version, a local file shadowing the package, or a different interpreter than the one where Seaborn was upgraded.
When was histplot added to Seaborn?
histplot is part of modern Seaborn releases; check the installed version and upgrade in the interpreter that runs the script.
How do I check which Seaborn Python imports?
Print seaborn.__version__ and seaborn.__file__ from the same process that runs the chart.
Should I use distplot instead?
distplot was deprecated; prefer histplot in a supported Seaborn version and use a deliberate fallback only when legacy compatibility is required.