Quick answer: Use ax.set_aspect(‘equal’) when data units must have equal visual scale, and ax.set_box_aspect(height / width) when the physical axes box shape is the requirement. Images add a separate imshow aspect policy.
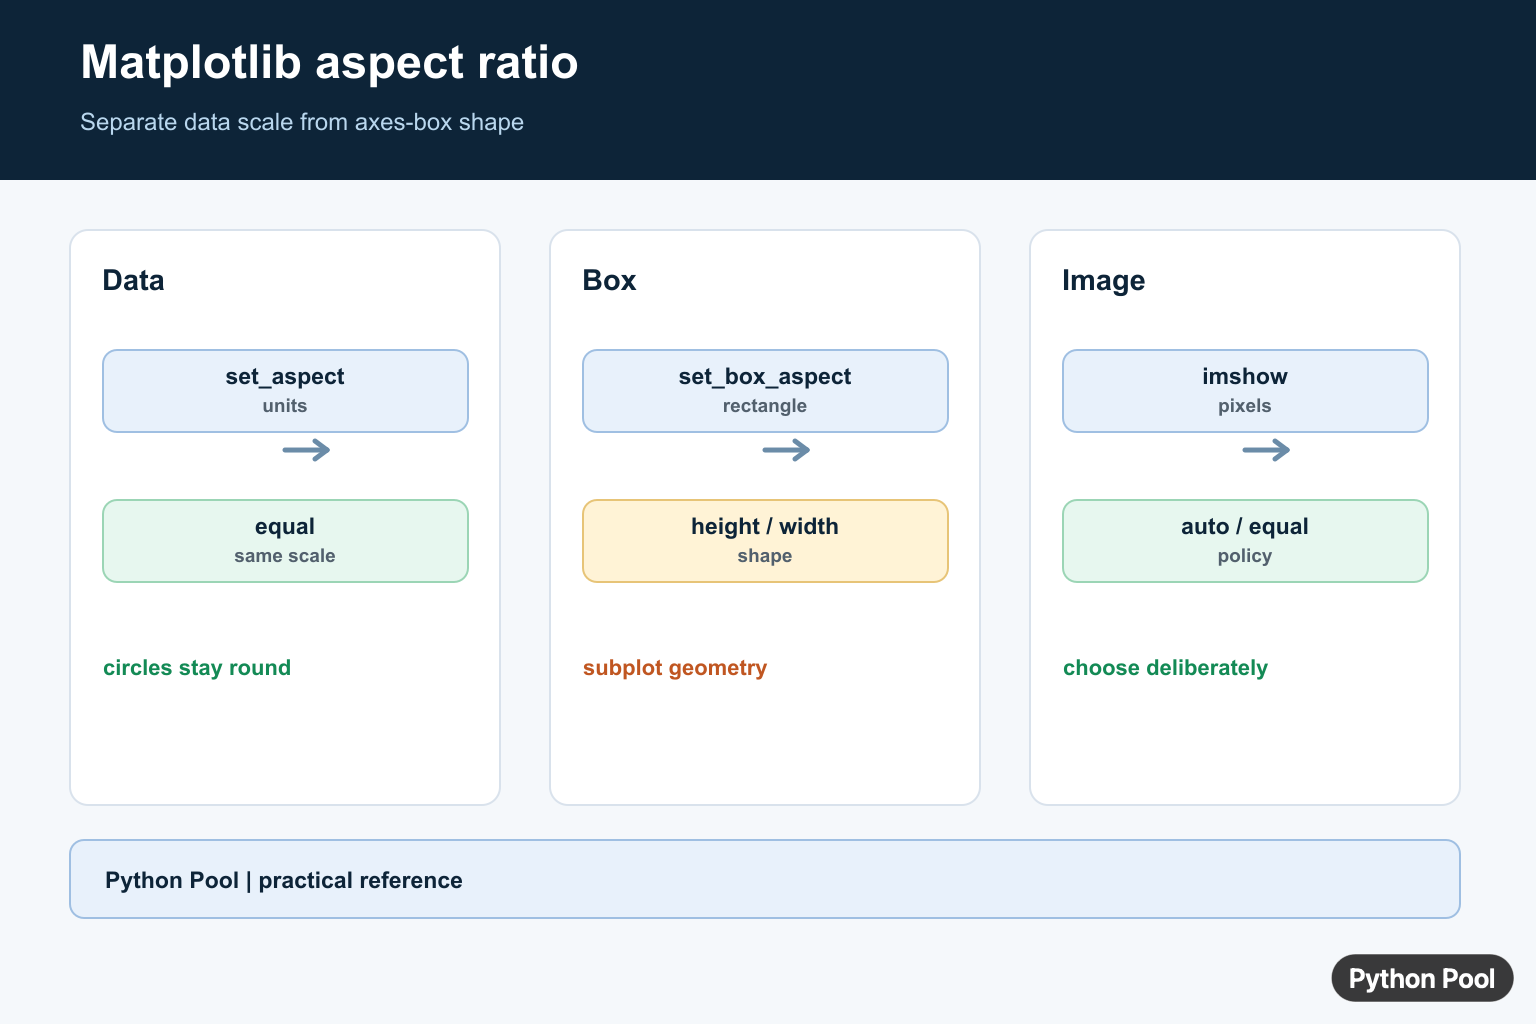
Matplotlib aspect ratio controls how data units are scaled on a plot. It is the reason a circle can look like a circle instead of an ellipse, or why an image can fill an axes without preserving its original proportions.
The key is to separate three related ideas: data aspect, axes box aspect, and figure size. They sound similar, but they solve different problems.
Quick answer
Use ax.set_aspect("equal") when one unit on the x-axis should have the same screen length as one unit on the y-axis:
import matplotlib.pyplot as plt

fig, ax = plt.subplots()
ax.plot([0, 1, 2], [0, 1, 0])
ax.set_aspect("equal", adjustable="box")
plt.show()
The official Axes.set_aspect documentation defines "equal" as the same as aspect=1, meaning x and y data units use the same scaling.
Aspect ratio vs figure size
Aspect ratio is not the same as figure size. Figure size controls the physical size of the whole figure:
fig, ax = plt.subplots(figsize=(8, 4))
Aspect ratio controls how data is drawn inside an axes:
ax.set_aspect("equal")
If you only want a wider or taller output image, change figsize or use Figure.set_size_inches(). If geometric shapes or map distances look distorted, change the axes aspect ratio. Matplotlib’s Figure.set_size_inches documentation covers figure sizing.
Use ax.set_aspect()
Axes.set_aspect() accepts three common forms:
| Value | Meaning |
|---|---|
"auto" |
Fill the available axes rectangle with data. |
"equal" |
Use equal x and y data scaling. |
float |
Scale one y data unit as that many x data units on screen. |
Here is a clear example with a circle:
import numpy as np
import matplotlib.pyplot as plt

theta = np.linspace(0, 2 * np.pi, 200)
x = np.cos(theta)
y = np.sin(theta)

fig, ax = plt.subplots()
ax.plot(x, y)
ax.set_aspect("equal", adjustable="box")
ax.set_title("Circle with equal aspect")
plt.show()
Without equal aspect, Matplotlib may stretch the axes rectangle and the circle can appear elliptical.
Use plt.axis(“equal”)
plt.axis("equal") is a concise pyplot shortcut for equal scaling:
import numpy as np
import matplotlib.pyplot as plt

theta = np.linspace(0, 2 * np.pi, 200)
plt.plot(np.cos(theta), np.sin(theta))
plt.axis("equal")
plt.show()
The official equal axis aspect ratio example demonstrates the same problem: equal data scaling matters for shapes like circles. For larger codebases, prefer the object-oriented style with fig, ax = plt.subplots() because it is clearer which axes you are changing.
Use a custom numeric aspect
A numeric aspect value changes the ratio between y and x data units. For example, aspect=2 makes one y-unit display twice as tall as one x-unit:
import matplotlib.pyplot as plt

fig, ax = plt.subplots()
ax.plot([0, 1, 2], [0, 1, 0])
ax.set_aspect(2, adjustable="box")
plt.show()
Use numeric aspect values when you intentionally want non-equal data scaling. For most geometry plots, maps, and circles, "equal" is easier to reason about.
Set image aspect ratio with imshow()
imshow() has its own aspect argument. Use aspect="equal" to preserve square pixels, or aspect="auto" to fill the axes rectangle:
import numpy as np
import matplotlib.pyplot as plt

data = np.arange(100).reshape(10, 10)

fig, axes = plt.subplots(1, 2, figsize=(8, 3))
axes[0].imshow(data, aspect="equal")
axes[0].set_title("equal")

axes[1].imshow(data, aspect="auto")
axes[1].set_title("auto")

plt.show()
Use aspect="equal" for images where pixel shape matters. Use aspect="auto" for heatmaps or compact dashboard plots where filling space is more important. Our Matplotlib imshow guide covers image display in more detail.
Set the axes box aspect
set_aspect() controls data scaling. set_box_aspect() controls the physical height-to-width ratio of the axes box itself:
import matplotlib.pyplot as plt

fig, ax = plt.subplots()
ax.plot([1, 2, 3], [2, 5, 4])
ax.set_box_aspect(1)  # square axes box
plt.show()
This is useful when you want the axes area to be square even if the data limits are not. See the official Axes.set_box_aspect documentation for details.
3D plot aspect ratio
For 3D axes, use set_box_aspect() with three values. A common pattern is to pass the data ranges for x, y, and z:
import numpy as np
import matplotlib.pyplot as plt

x = np.linspace(-2, 2, 30)
y = np.linspace(-2, 2, 30)
x, y = np.meshgrid(x, y)
z = np.sin(x ** 2 + y ** 2)

fig = plt.figure()
ax = fig.add_subplot(projection="3d")
ax.plot_surface(x, y, z)
ax.set_box_aspect((np.ptp(x), np.ptp(y), np.ptp(z)))
plt.show()
np.ptp() returns the range from minimum to maximum. This helps the 3D box reflect the data range on each axis.
Use gca() carefully
You may see examples like this:
plt.plot([0, 1], [0, 1])
plt.gca().set_aspect("equal")
plt.gca() gets the current axes. It does not specifically select a polar axes. The object-oriented style is usually safer:
fig, ax = plt.subplots()
ax.plot([0, 1], [0, 1])
ax.set_aspect("equal")
If you need more context, see our guide to Matplotlib gca().
Common mistakes
- Changing
figsizewhen the real problem is unequal data scaling. - Using
aspect="auto"for images where square pixels matter. - Setting aspect on the wrong axes in a multi-subplot figure.
- Using
plt.gca()in complex figures instead of keeping an explicitaxvariable. - Expecting
set_aspect()to resize the whole exported image; use figure size for that.
Related Matplotlib guides
For layout and sizing, see Matplotlib figsize. For styling, see Matplotlib background color. For cleaning axes before redrawing, see how to clear a plot in Matplotlib.
Conclusion
Use ax.set_aspect("equal") when x and y data units should have the same scale, imshow(aspect="auto") or imshow(aspect="equal") for image display, and set_box_aspect() when the physical axes box needs a fixed shape. Keep figure size separate from data aspect and your Matplotlib plots will be much easier to control.
Match Data Units With set_aspect
For geometry, maps, circles, and scatter plots, an equal data aspect prevents one unit from appearing longer on one axis than the other. auto lets the axes fill its available box, while numeric values define the y-unit to x-unit display ratio.
import matplotlib.pyplot as plt

fig, ax = plt.subplots()
ax.plot([0, 1], [0, 1])
ax.set_aspect("equal")
ax.set_xlim(0, 1)
ax.set_ylim(0, 1)
fig.tight_layout()
Control The Physical Axes Box
set_box_aspect controls the height-to-width ratio of the axes rectangle rather than the data-unit scaling. This is useful when two subplots should have matching physical shapes even if their numeric limits differ.
fig, ax = plt.subplots(figsize=(6, 4))
ax.set_box_aspect(1)
ax.plot([0, 1], [0, 3])
fig.tight_layout()
Images And Layout Need Their Own Policy
imshow can preserve image pixels with aspect=’equal’ or fill the axes with aspect=’auto’. Figure size, limits, constrained layout, and tight_layout can all change the available box, so inspect the rendered result instead of treating aspect as a crop or resize operation.
import numpy as np

image = np.arange(12).reshape(3, 4)
fig, axes = plt.subplots(1, 2, figsize=(8, 3))
axes[0].imshow(image, aspect="equal")
axes[1].imshow(image, aspect="auto")
fig.tight_layout()
Matplotlib’s set_aspect() and set_box_aspect() references separate data scaling from axes-box geometry.
For related figure layout decisions, compare boxplots, figure sizing, and tight layout when the rendered geometry needs to stay readable.
Frequently Asked Questions
How do I set an equal aspect ratio in Matplotlib?
Call ax.set_aspect(‘equal’) or plt.axis(‘equal’) when one unit on the x-axis should have the same visual size as one unit on the y-axis.
What is the difference between aspect and box aspect?
set_aspect controls the scale relationship between data units, while set_box_aspect controls the physical height-to-width ratio of the axes box.
How do I set the aspect ratio of an image?
Pass aspect to imshow() or set it on the Axes, depending on whether the image should preserve pixels or fill the available axes.
Why does my plot look stretched after setting the aspect?
The figure size, limits, layout engine, and axes box can constrain the requested ratio; inspect the axes geometry and choose the aspect policy deliberately.