Matplotlib Text: Labels, Titles, Annotations, and Coordinates
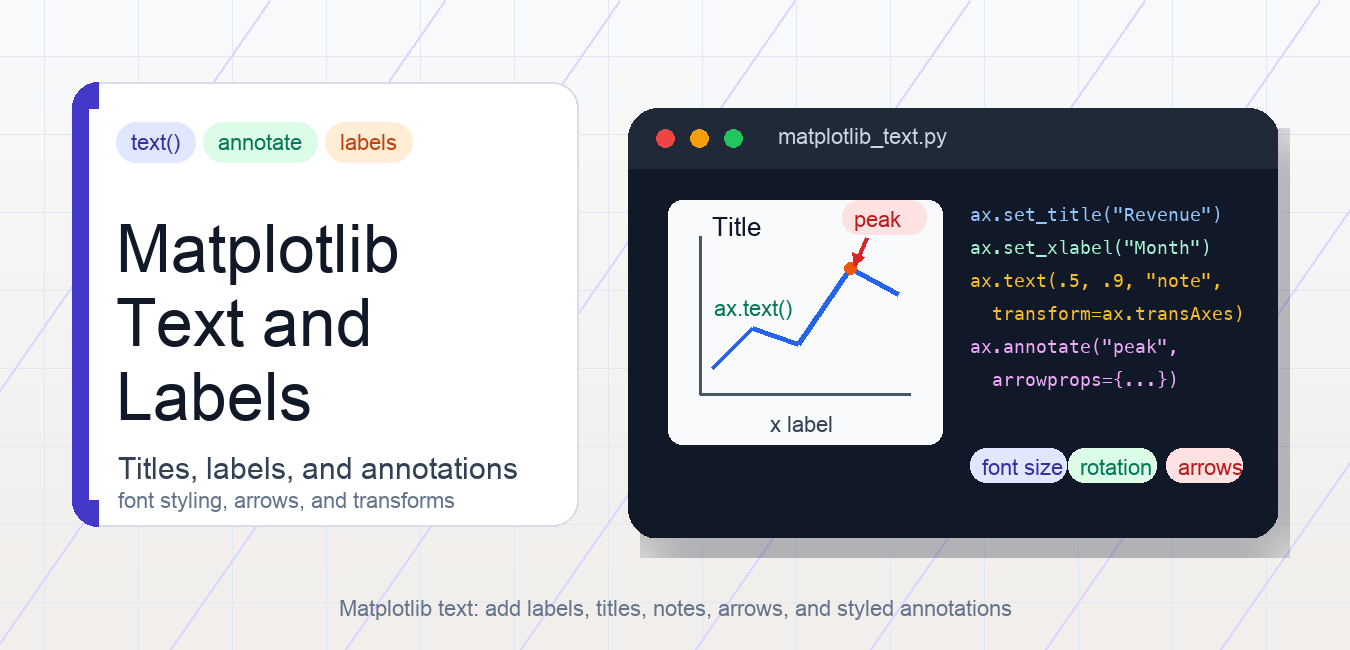
Add readable Matplotlib text with ax.text, titles, labels, annotations, coordinate systems, styling, zorder, and export-safe layout.
Browse practical Python tutorials, error fixes, library guides, data science examples, and project ideas from Python Pool.
Add readable Matplotlib text with ax.text, titles, labels, annotations, coordinate systems, styling, zorder, and export-safe layout.

Calculate variance with NumPy, choose population or sample degrees of freedom, reduce along an axis, and handle missing values without silent statistical errors.
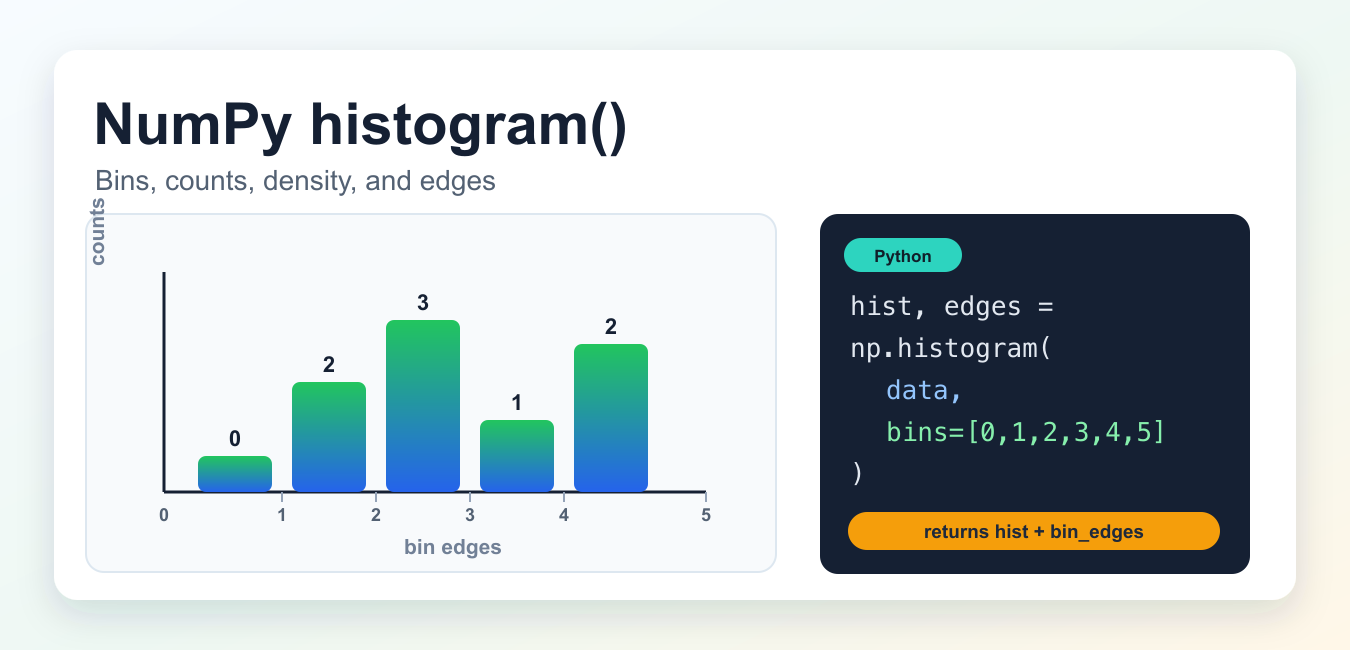
Use NumPy histogram() to choose bins, ranges, density, weights, and edges while interpreting counts and plotting distributions correctly.
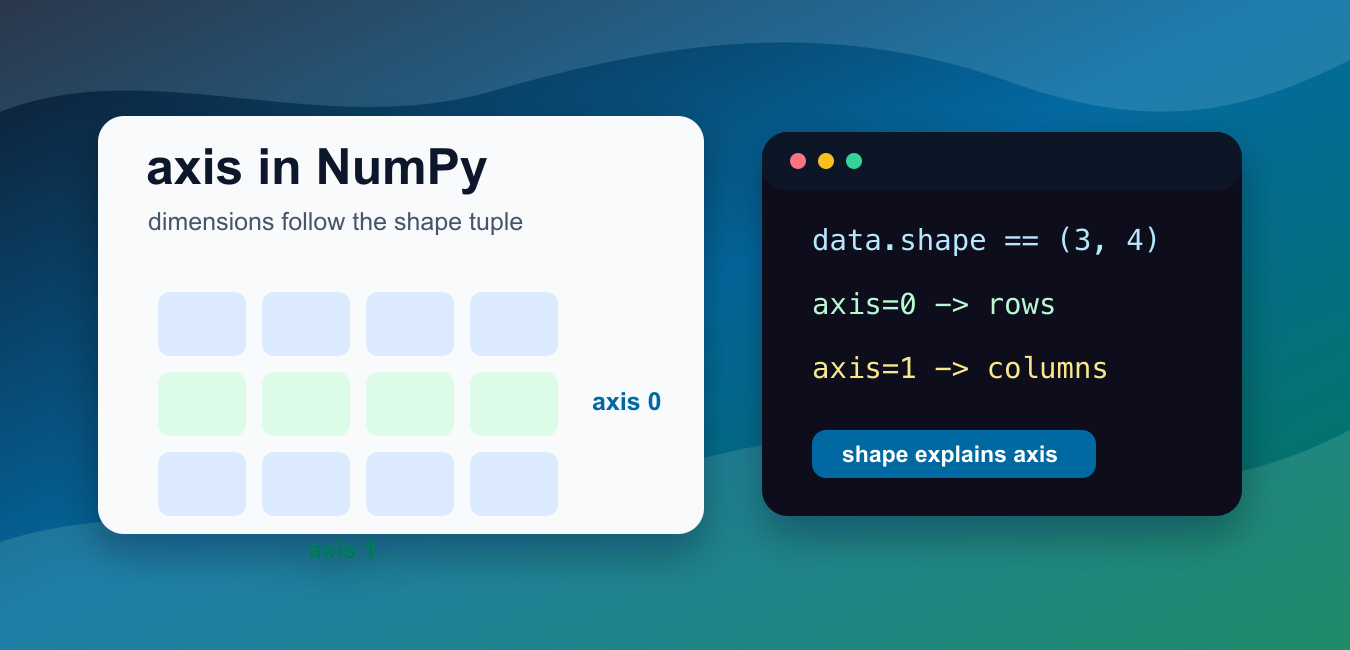
Understand NumPy axes with shapes, axis 0 and 1 reductions, negative axes, keepdims, and examples that prevent dimension mistakes.
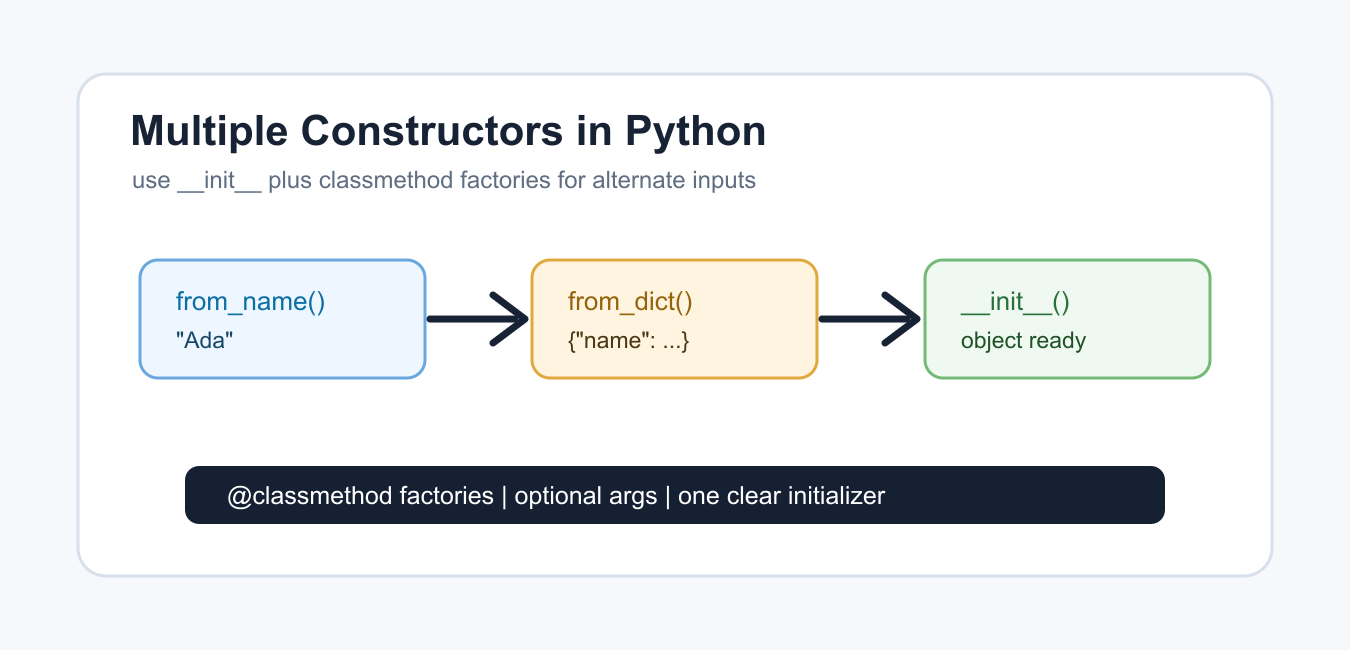
Learn how Python classes handle one __init__ method, alternate constructors with classmethod, inheritance, validation, and factory patterns.
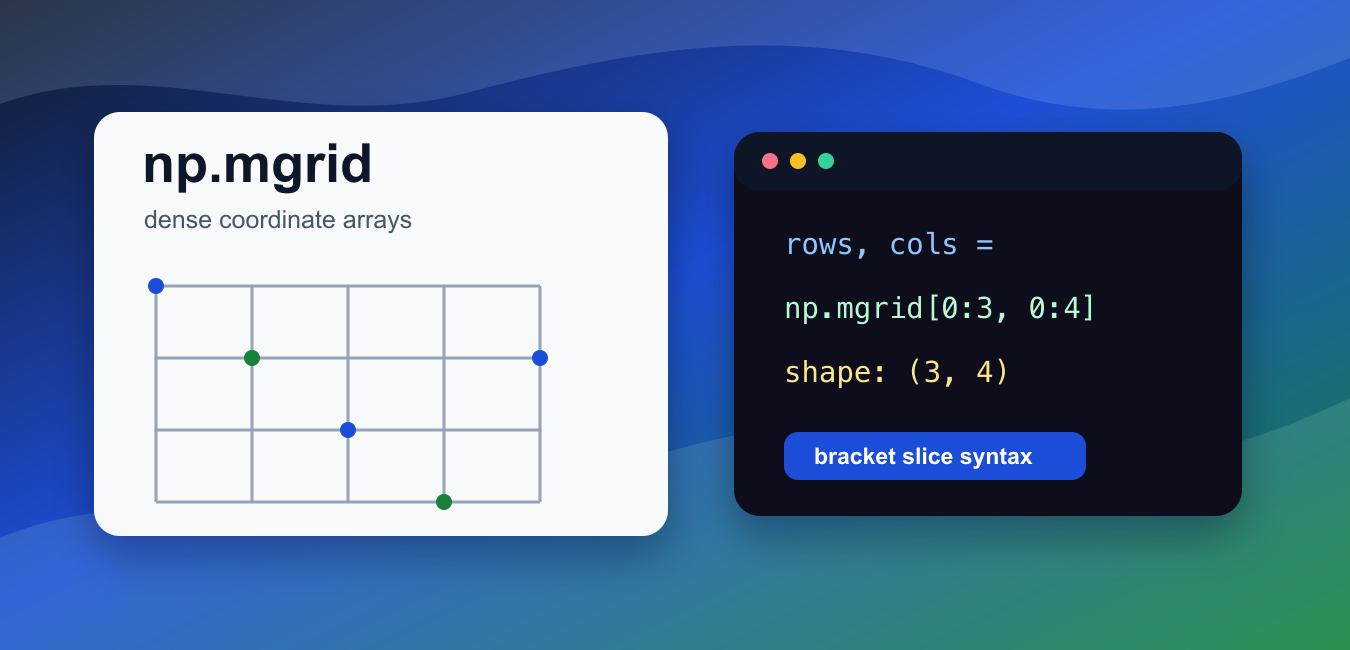
Use NumPy mgrid for dense coordinate grids, understand integer and complex slice steps, compare ogrid and meshgrid, and manage memory.

Use NumPy digitize to assign values to bins, understand right boundaries, handle out-of-range values, and convert bin indices into labels.
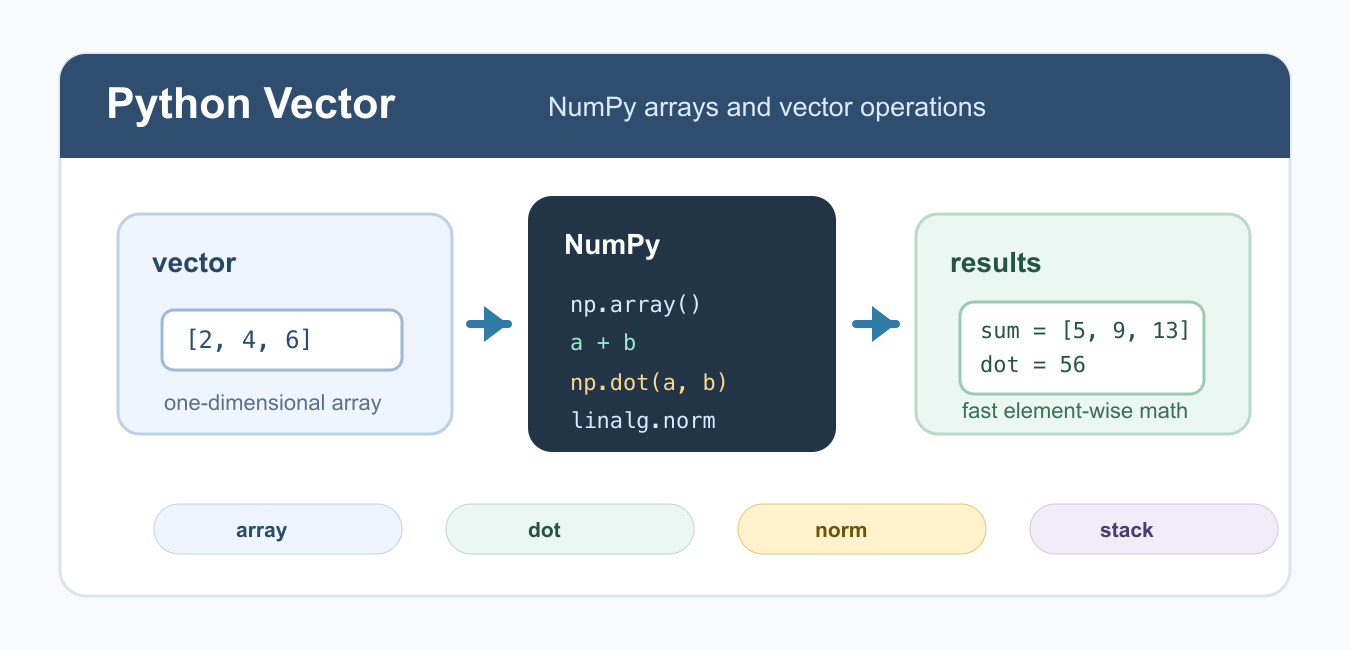
Work with Python vectors using NumPy arrays, element-wise math, dot products, norms, shapes, broadcasting, and validation.
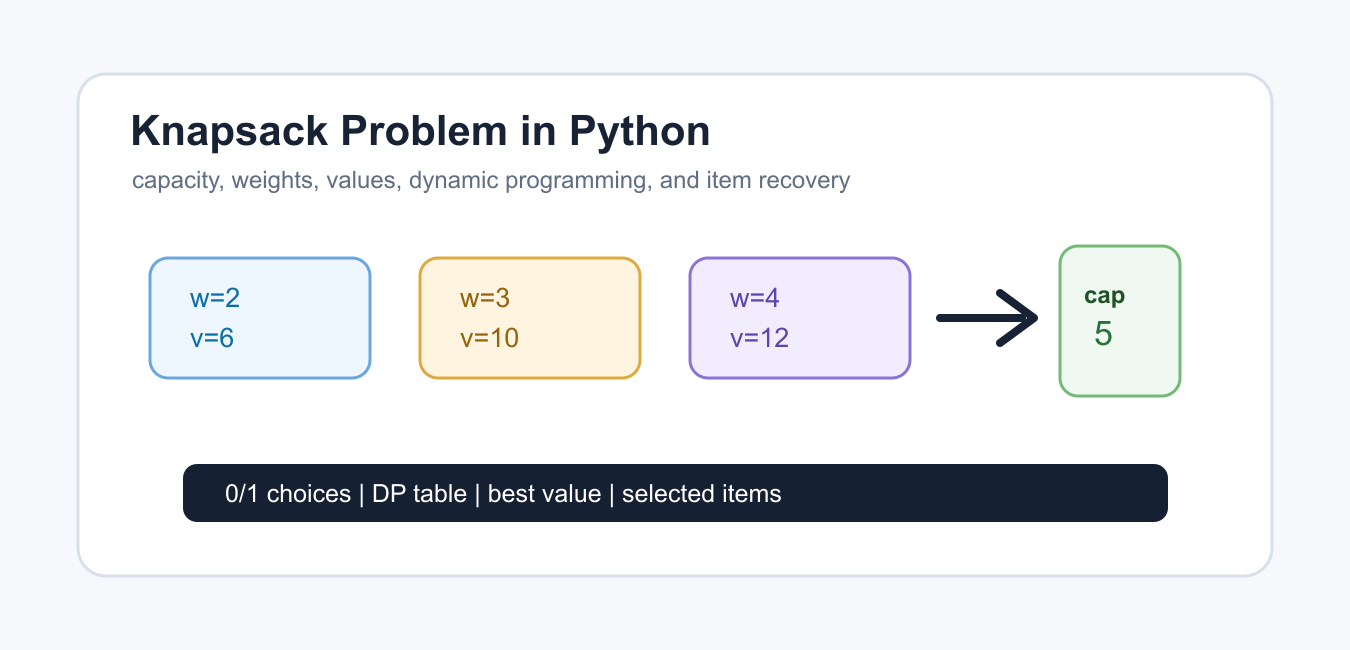
Solve the 0/1 knapsack problem in Python with dynamic programming, capacity states, reconstruction, complexity, and greedy limitations.
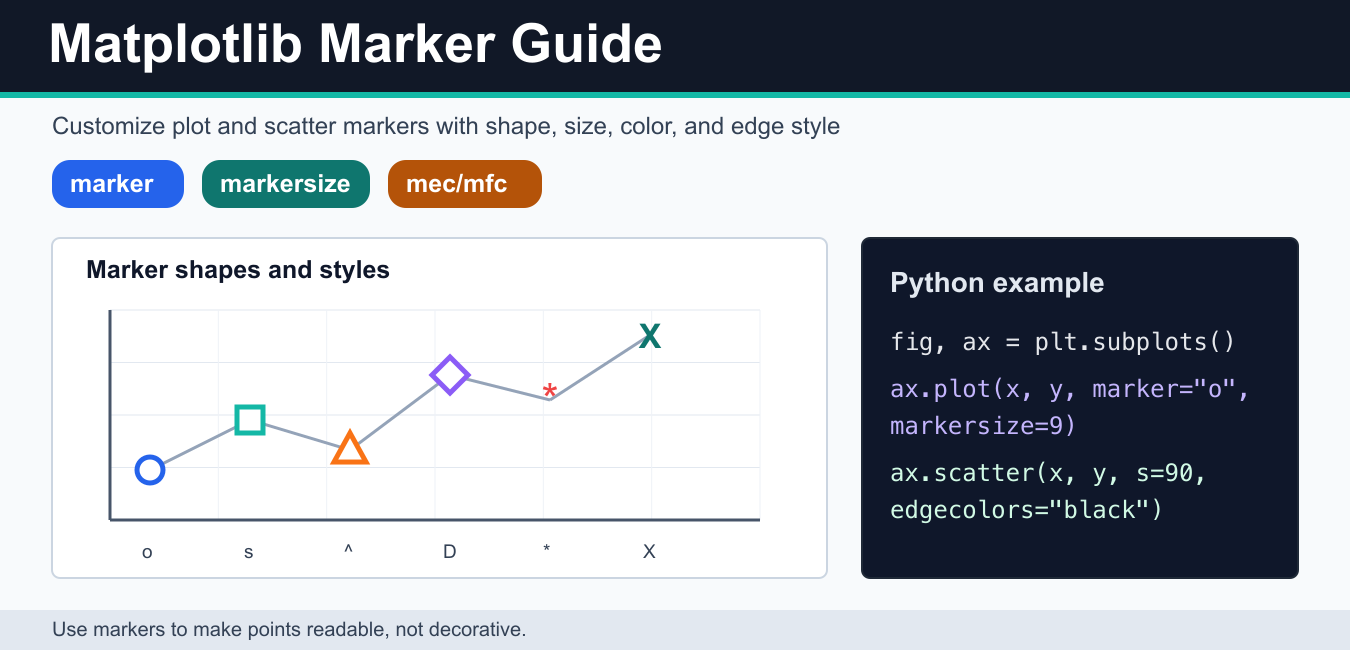
Customize Matplotlib markers with shape, size, face and edge colors, transparency, scatter sizing, and reusable MarkerStyle examples.