Matplotlib Vertical Lines: axvline(), vlines(), and plot()
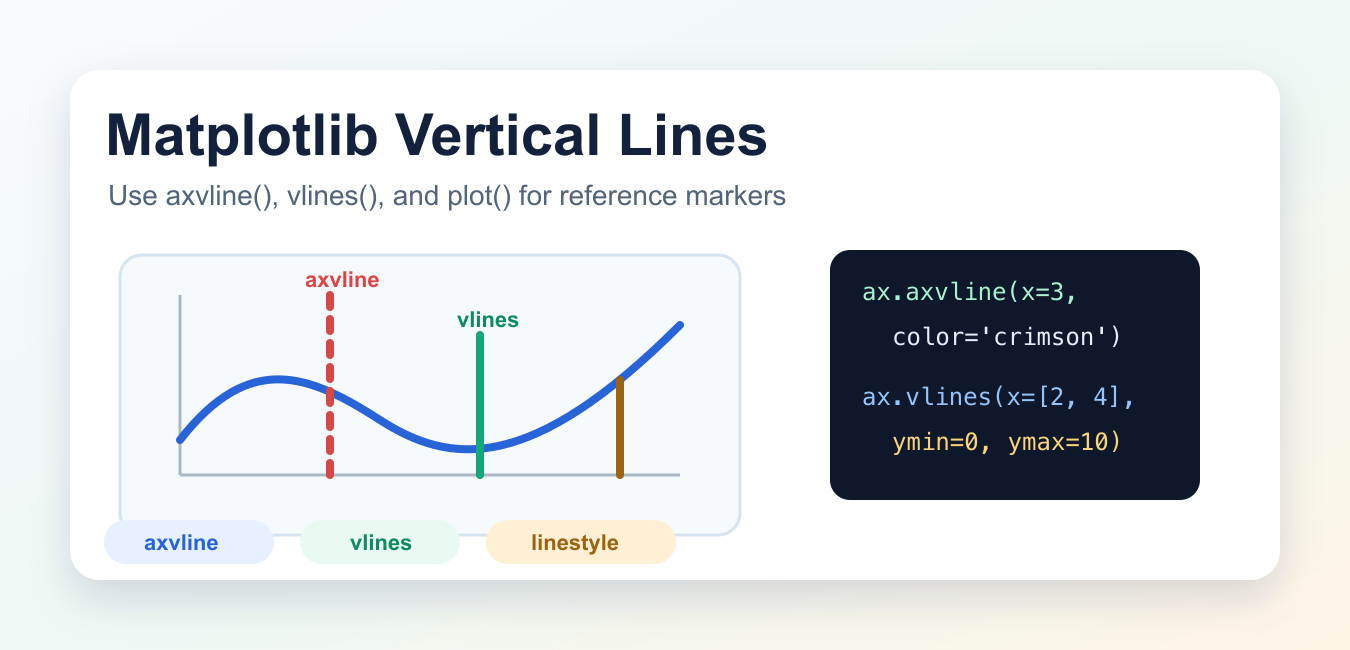
Draw Matplotlib vertical markers with axvline(), data-space segments with vlines(), and ordinary line data with plot().
Browse practical Python tutorials, error fixes, library guides, data science examples, and project ideas from Python Pool.
Draw Matplotlib vertical markers with axvline(), data-space segments with vlines(), and ordinary line data with plot().
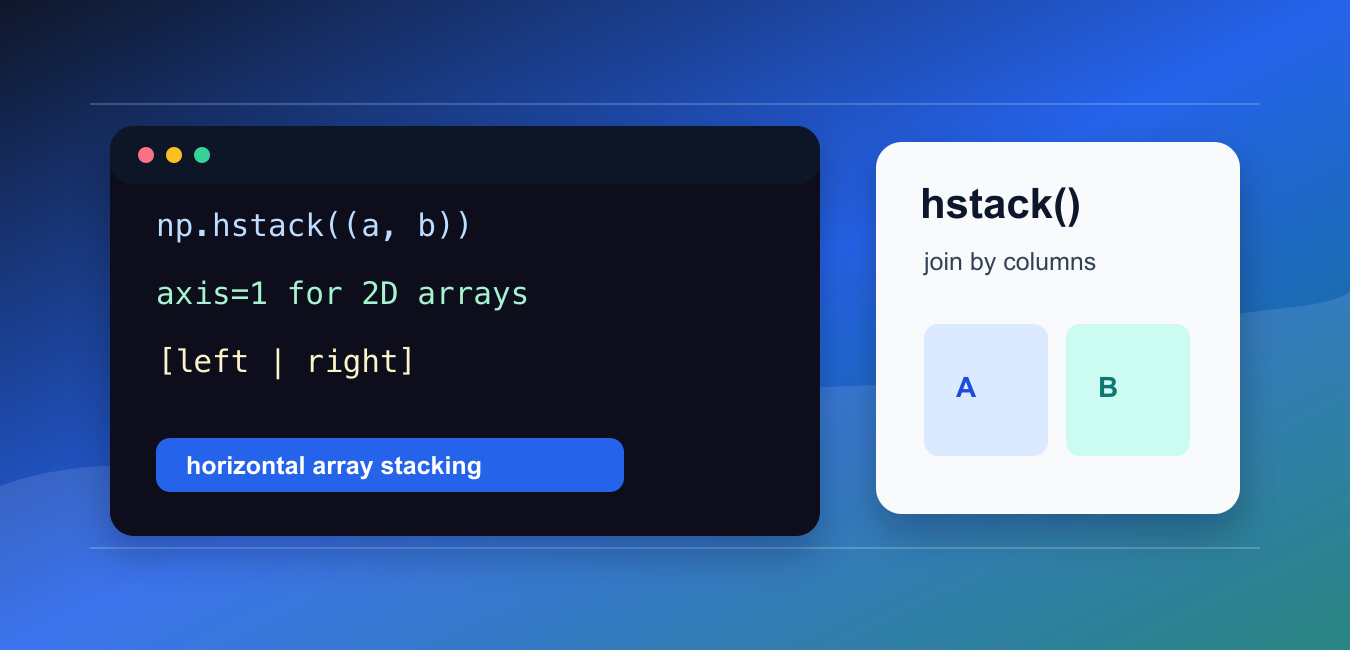
Use NumPy hstack() to join vectors and matrices horizontally, understand one- and two-dimensional shape rules, and avoid mismatched layouts.
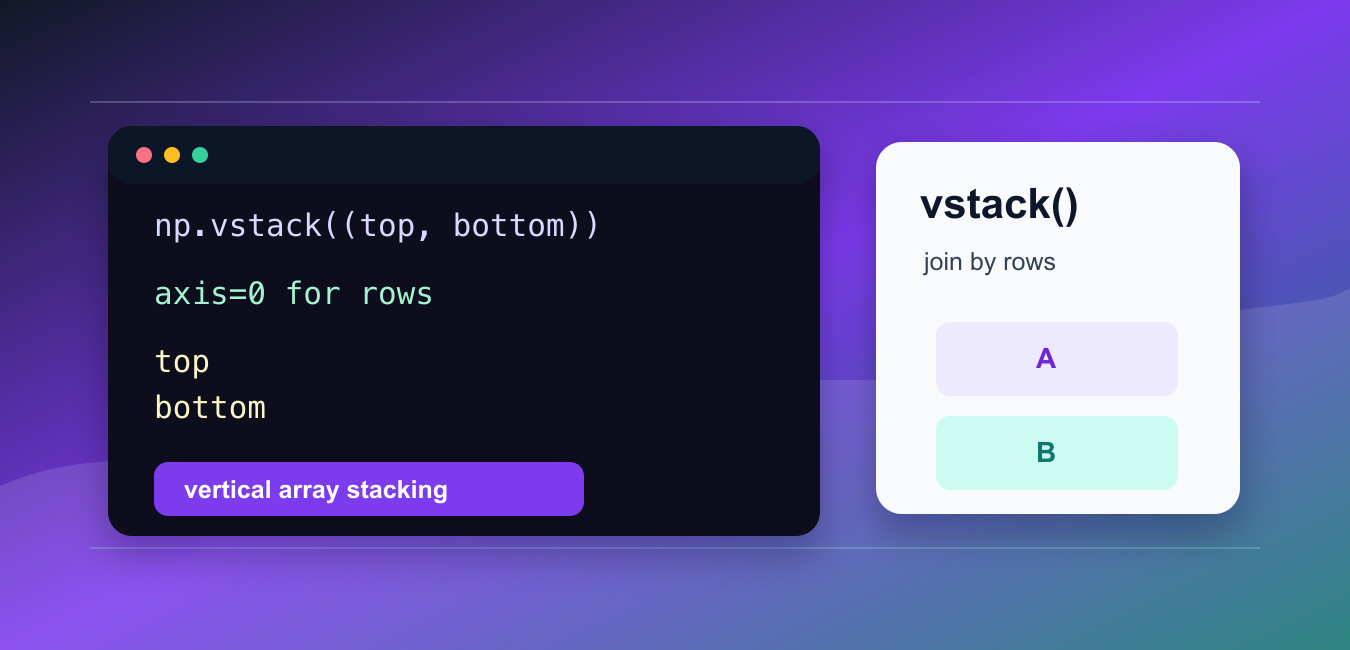
Use NumPy vstack() to combine arrays by rows, understand one-dimensional promotion, validate shapes, and choose concatenate or stack when the operation differs.
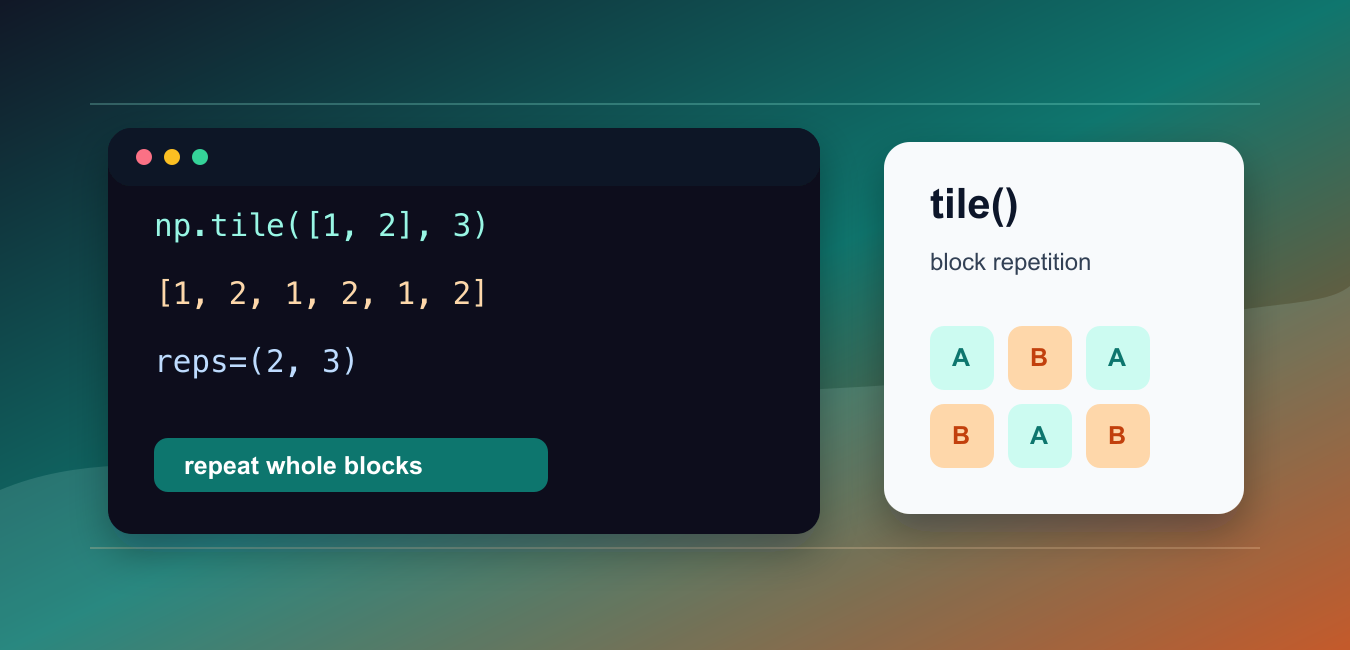
Repeat NumPy array patterns with tile(), understand reps and shape promotion, compare repeat(), and avoid unnecessary copies for arithmetic.

Use NumPy squeeze() to remove axes of length one, select an axis deliberately, understand shape changes, and avoid dimension errors.

Create Matplotlib tables with cellText, row and column labels, widths, colors, font size, and readable layout control.
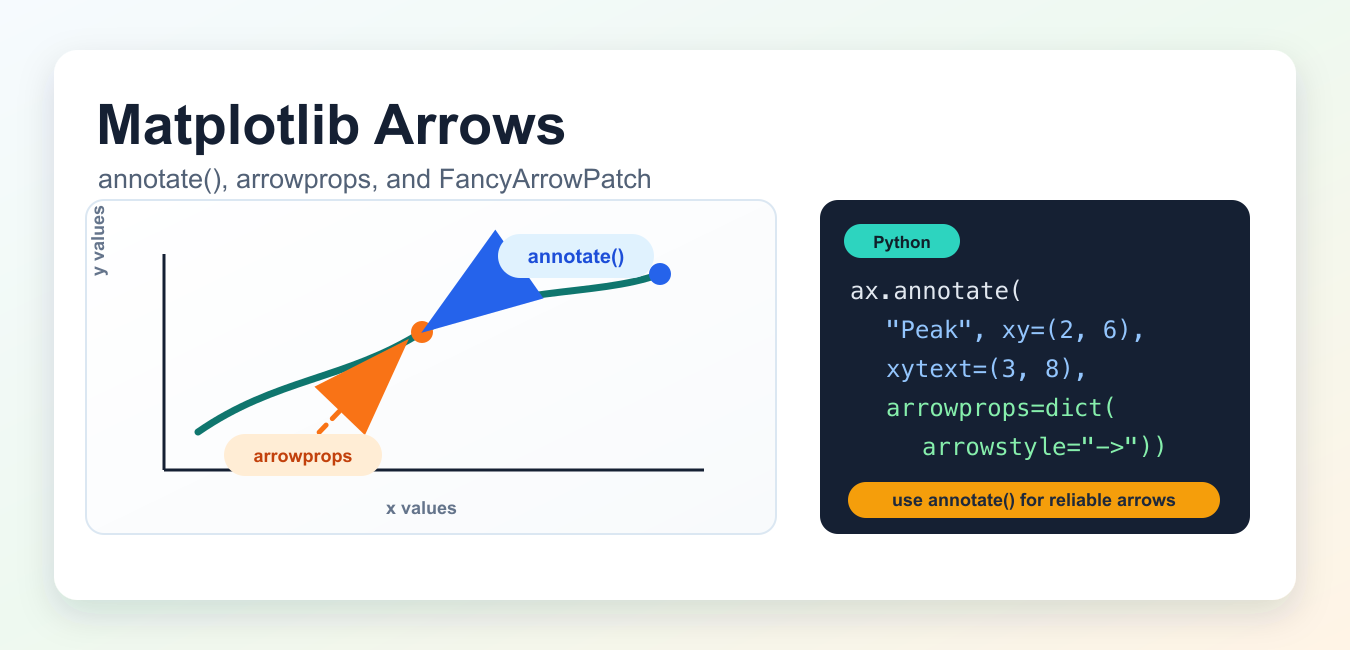
Draw Matplotlib arrows with annotate and patch controls, position arrowheads correctly, and keep labels readable across plots and responsive exports.

Use NumPy convolve for one-dimensional signals, understand full same and valid modes, choose operand order, and avoid unexpected output lengths.
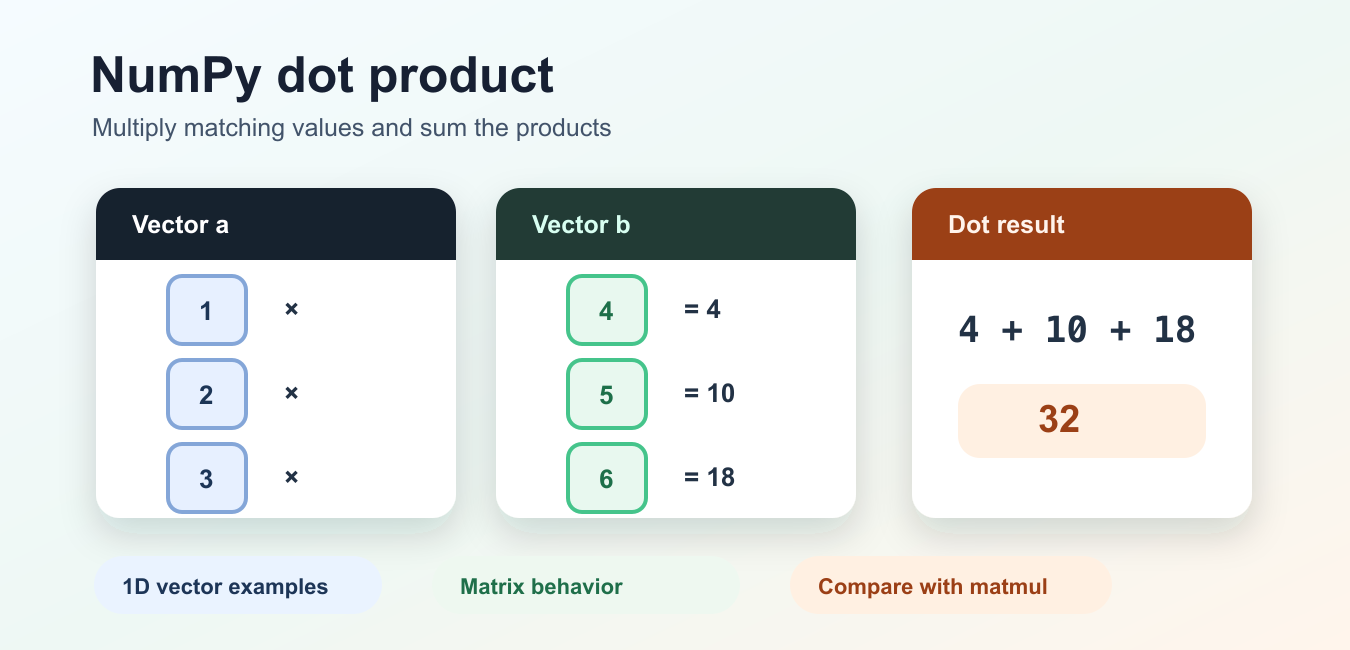
Use np.dot() correctly by checking dimensions, separating vector, matrix, and element-wise multiplication, and choosing the clearest NumPy API.
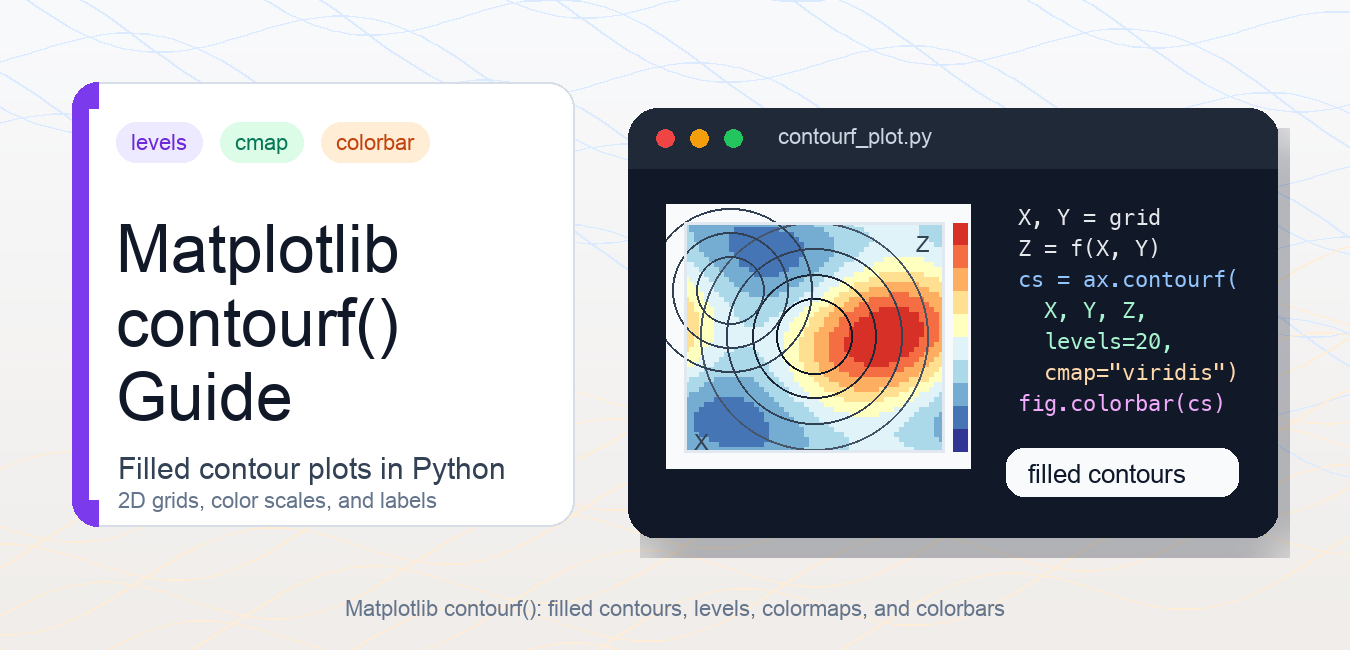
Use Matplotlib contourf() with X, Y, Z grids, levels, colormaps, colorbars, contour lines, normalization, and layout checks.