Matplotlib ylim(): Set and Read Y-Axis Limits

Use Matplotlib ylim to set y-axis limits, inspect current bounds, preserve automatic scaling, and avoid hiding data with restrictive chart ranges.
Browse practical Python tutorials, error fixes, library guides, data science examples, and project ideas from Python Pool.
Use Matplotlib ylim to set y-axis limits, inspect current bounds, preserve automatic scaling, and avoid hiding data with restrictive chart ranges.
Learn the conditional expression syntax, truth-value behavior, precedence, and when a normal if statement is clearer.
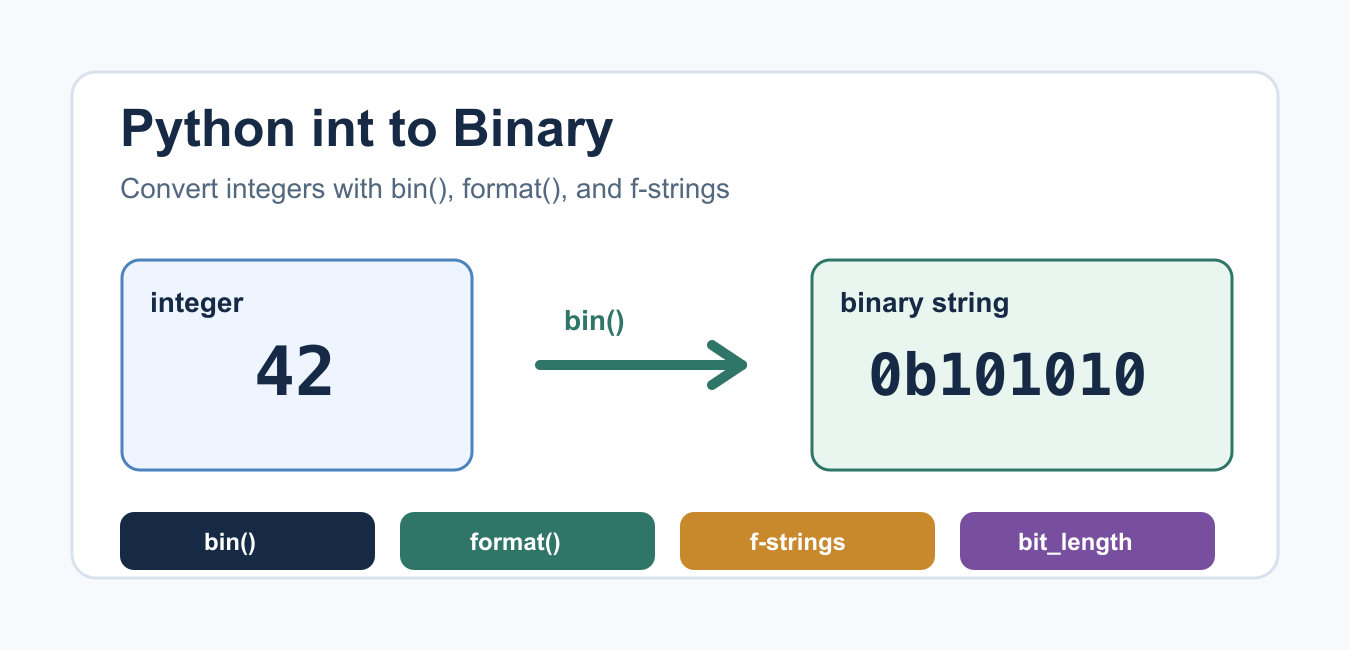
Convert Python int to binary with bin(), format(), f-strings, prefixes, padding, negative numbers, and manual division examples.

Make Matplotlib log charts honest by matching the transform to the data domain and labeling the base, limits, ticks, and invalid values.
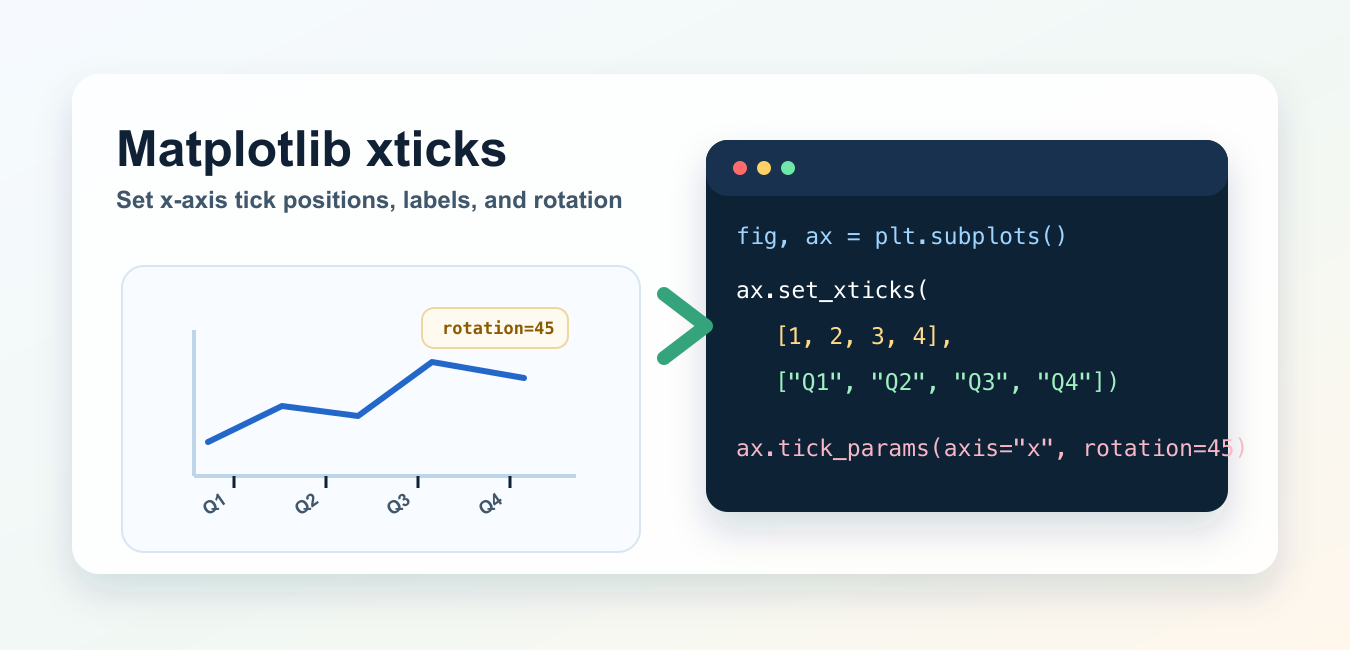
Control Matplotlib x-axis tick positions, labels, rotation, intervals, date ticks, and locator behavior with clear Axes examples.
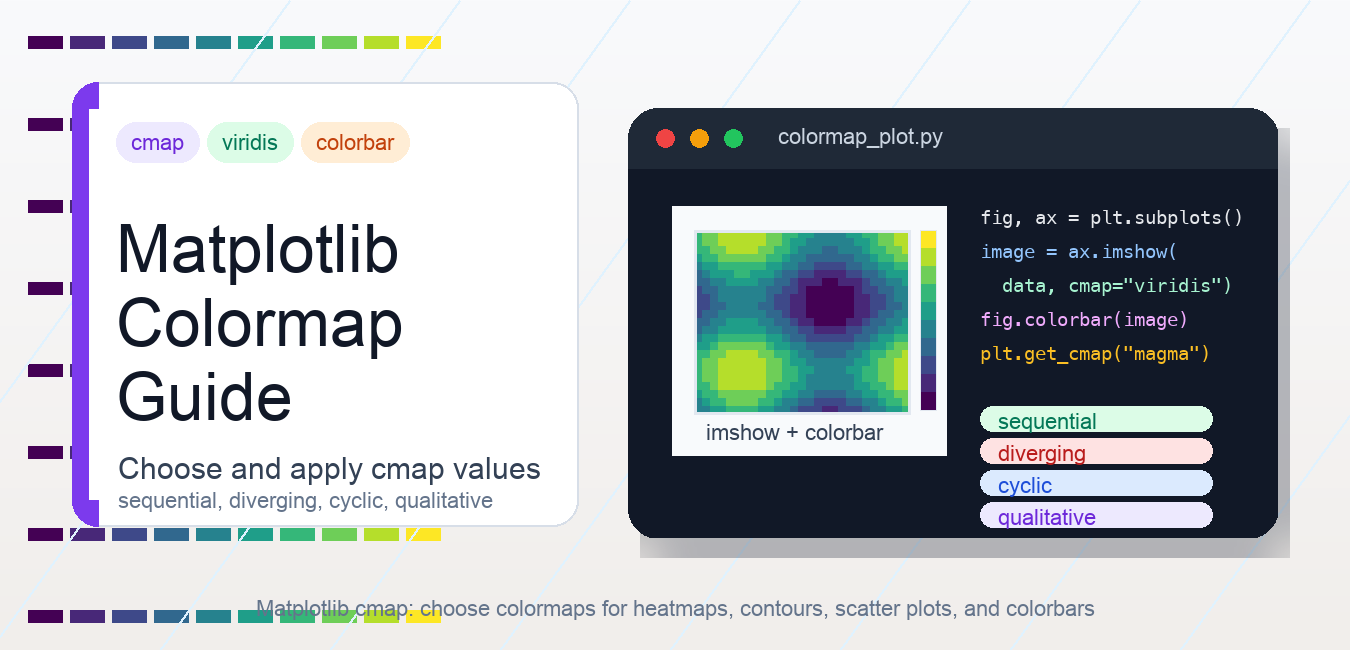
Use Matplotlib colormaps as a data contract: match palette type to semantics, fix comparable bounds, label units, and test accessibility.
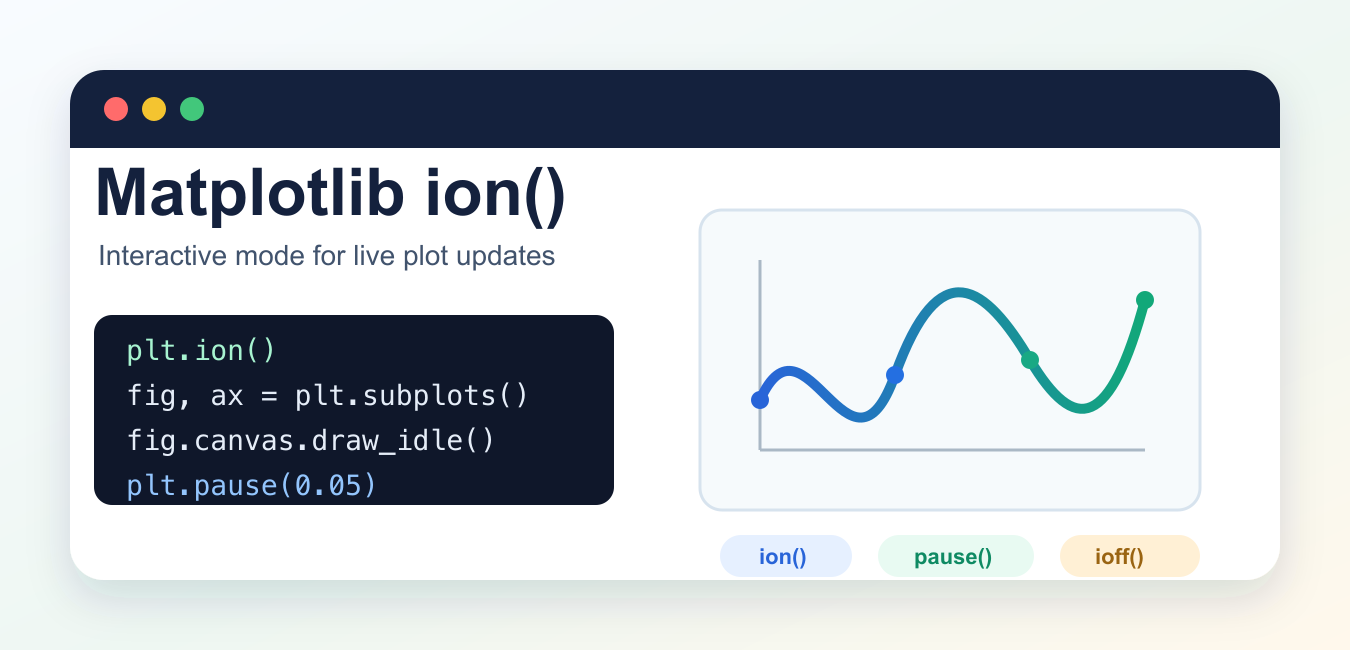
Use Matplotlib ion(), ioff(), isinteractive(), and pause() correctly for interactive shells, live updates, and non-blocking plot workflows.

Use Matplotlib savefig to export PNG, PDF, and SVG files with correct dpi, bbox_inches, transparent backgrounds, and predictable paths.
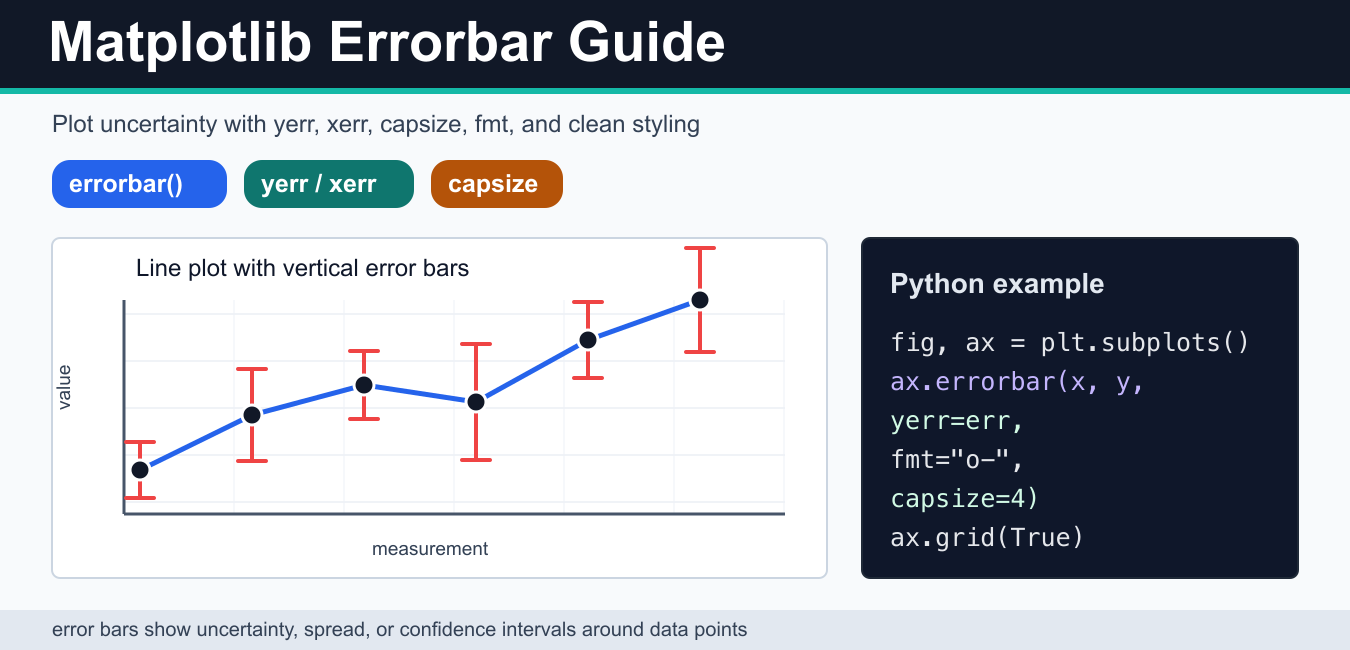
Use Matplotlib errorbar() with yerr, xerr, asymmetric uncertainty, capsize, log scales, and readable error-bar styling.
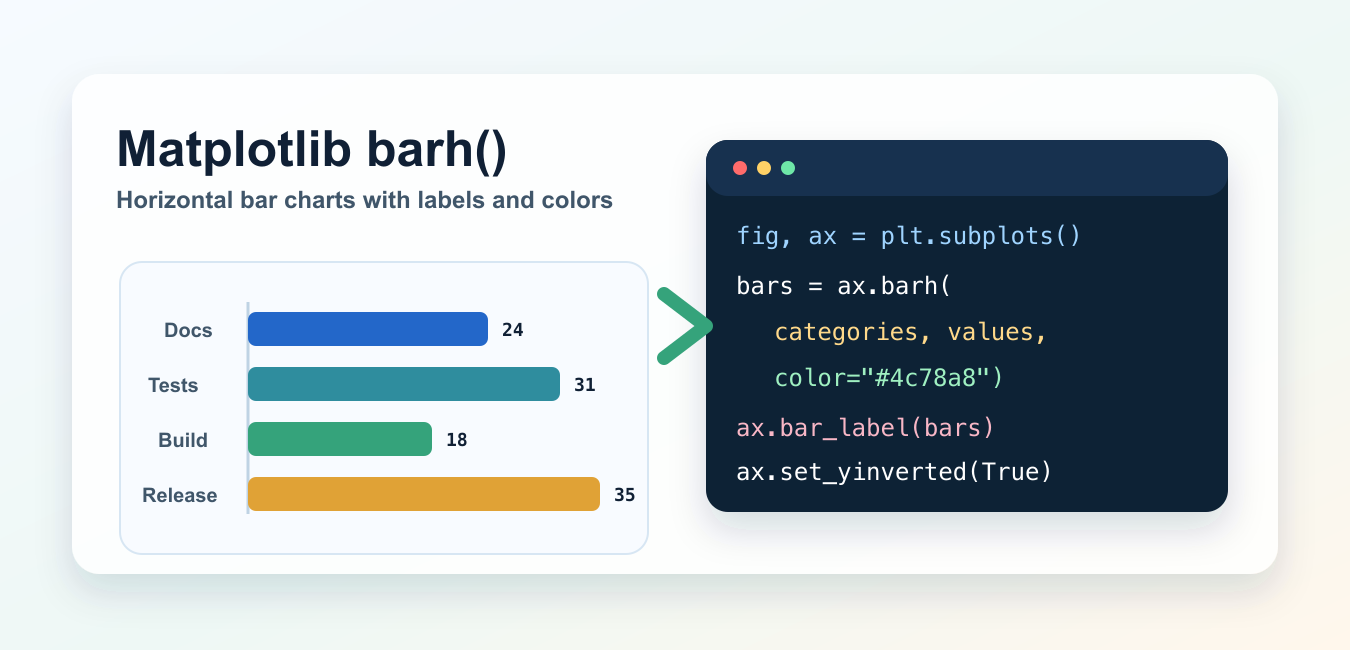
Use Matplotlib barh() to create readable horizontal charts, sort categories, add labels and error bars, and build stacked comparisons.