Hello programmers, in today’s article, we will discuss how to implement Matplotlib vertical lines in Python. As we already know, Matplotlib is a prevalent python library that helps in plotting. Implementation of Matplotlib vertical lines basically means to draw single vertical lines using the different functions of the matplotlib library. Before we start with different examples of using matplotlib vertical lines in our programs, let me brief you about the syntax and return the same.
Syntax of matplotlib vertical lines in python
matplotlib.pyplot.vlines(x, ymin, ymax, colors='k', linestyles='solid', label='', *, data=None, **kwargs)Parameters
- x: Scalar or 1D array containing x-indexes were to plot the lines.
- ymin, ymax: Scalar or 1D array containing respective beginning and end of each line. All lines will have the same length if scalars are provided.
- colors: Array of colors. (Optional; default: ‘k’)
- linestyles: Can be ‘solid’, ‘dashed’, ‘dash-dot’, ‘dotted’. (Optional)
- label: String (Optional; default: ”)
- **kwargs: Control properties of vertical lines to be plotted.
Return type of Matplotlib vertical line
Plots vertical lines at each x from ymin to ymax. Thus returns line collection of vertical lines.
Matplotlib vertical line using vline()
import matplotlib.pyplot as plt
import numpy as np
s = [1, 100]
plt.figure(figsize = (10, 7))
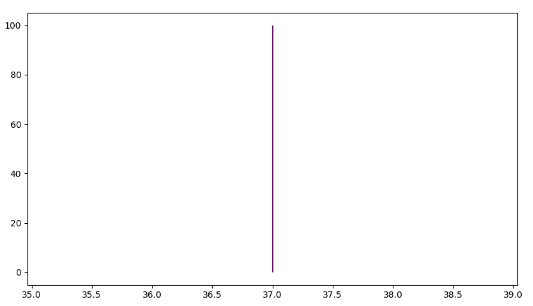
plt.vlines(x = 37, ymin = 0, ymax = max(s),
colors = 'purple',
label = 'vline_multiple - full height')
plt.show()
OUTPUT:
EXPLANATION:
The matplotlib.pyplot.vlines() function plots the vertical lines across the axes. The ‘vline’ in the function definition is an abbreviation for vertical lines. In the above example, the parameters passed to the matplotlib vline() function draws a vertical line accordingly. ‘x = 37’ indicates that it draws vertical line at the index 37 of the x-axis. The ‘ymin’ and ‘ymax’ marks the starting and ending point of the vertical line, respectively. The ‘ymin’ is 0, which is thus the starting point. And ‘ymax’ is max(s) where ‘s’ is an array defined as [1, 100]. The color parameter is purple, which plots the vertical line in purple color.
Matplotlib vertical lines in Python Using axvline()
import matplotlib.pyplot as plt
import numpy as np
plt.figure(figsize = (10, 5))
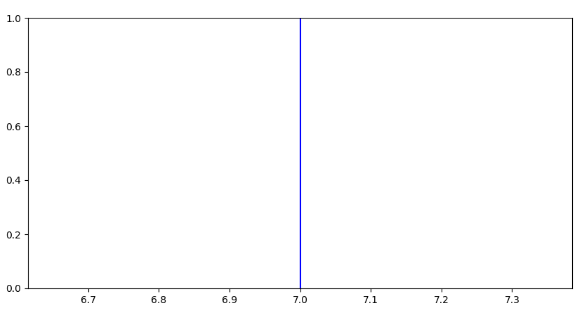
plt.axvline(x = 7, color = 'b', label = 'axvline - full height')
plt.show()
OUTPUT:
EXPLANATION:
Like the vline() function, the matplotlib axvline() is also used to draw vertical lines across the plot’s axes. The syntax for axvline function is : matplotlib.pyplot.axvline(x, color, xmin, xmax, linestyle). In the above example, ‘x’ is 7, which accepts integers to mark the position in the x-axis to plot the line. The ‘xmin’ and ‘xmax’ are optional parameters. Hence they are omitted here. Its default value is 0/1. The color is set to ‘b,’ which plots a blue-colored vertical line. And finally, the linestyle specifies the type of the line.
Matplotlib Vertical lines in Python using plot()
import matplotlib.pyplot as plt
# defining plot size
plt.figure(figsize = (10, 5))
# specifying plot coordinates
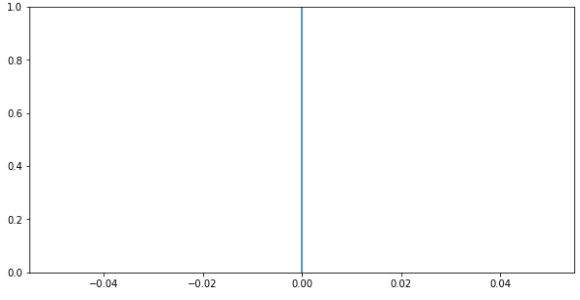
plt.plot((0, 0), (0, 1), scaley = False)
plt.show()
OUTPUT:
EXPLANATION:
The plot() function of the Matplotlib pyplot library creates a 2D hexagonal binning plot of points x, y. The syntax of plot function is: plot(x_points, y_points, scaley = False). In the above example, x_points and y_points are (0, 0) and (0, 1), respectively, which indicates the points to plot the line. The ‘scaley’ parameter determines if the view limits are these data limits. The ‘scaley’ is by default False. Setting scaley = True will make the line fit within the frame.
Multiple vertical lines using vlines()
import matplotlib.pyplot as plt
import numpy as np

# defining an array
xs = [1, 100]

# defining plot size
plt.figure(figsize = (10, 7))

# multiple lines all full height
plt.vlines(x = [37, 37.25, 37.5], ymin = 0, ymax = max(xs),
           colors = 'purple',
           label = 'vline_multiple - full height')

# multiple lines with varying ymin and ymax
plt.vlines(x = [38, 38.25, 38.5], ymin = [0, 25, 75], ymax = max(xs),
           colors = 'teal',
           label = 'vline_multiple - partial height')

# single vline with full ymin and ymax
plt.vlines(x = 39, ymin = 0, ymax = max(xs), colors = 'green',
           label = 'vline_single - full height')

# single vline with specific ymin and ymax
plt.vlines(x = 39.25, ymin = 25, ymax = max(xs), colors = 'green',
           label = 'vline_single - partial height')

# place legend outside
plt.legend(bbox_to_anchor = (1.0, 1), loc = 'up')
plt.show()
OUTPUT:
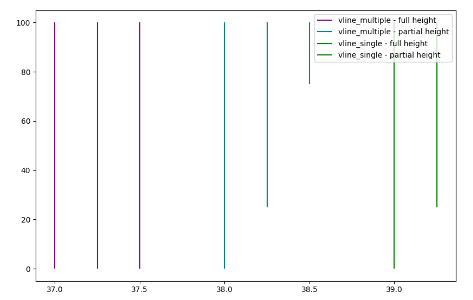
EXPLANATION:
In the above example, multiple vertical lines are plotted across the axes in the same plot. Multiple matplotlib.pyplot.vlines() function is used. But, different required parameters as arguments to get the desired line. The ‘colors’ and ‘label’ parameters sets the different colors and heights of vertical lines. The ‘label’ height is full or partial height as desired.
Also Read: Create GIF Using Python
Conclusion
We have discussed various ways of implementing a vertical line in python programs. We first start by importing matplotlib library to use the matplotlib vertical line function. Using vline(), axvline(), and plot are some of the matplotlib pyplot functions used to insert vertical lines. Moreover, it allows us to plat multiple lines in the same graph.
However, if you have any doubts or questions do let me know in the comment section below. I will try to help you as soon as possible.
Happy Pythoning!