Matrix Addition in Python: Lists, NumPy, Shapes, and Validation
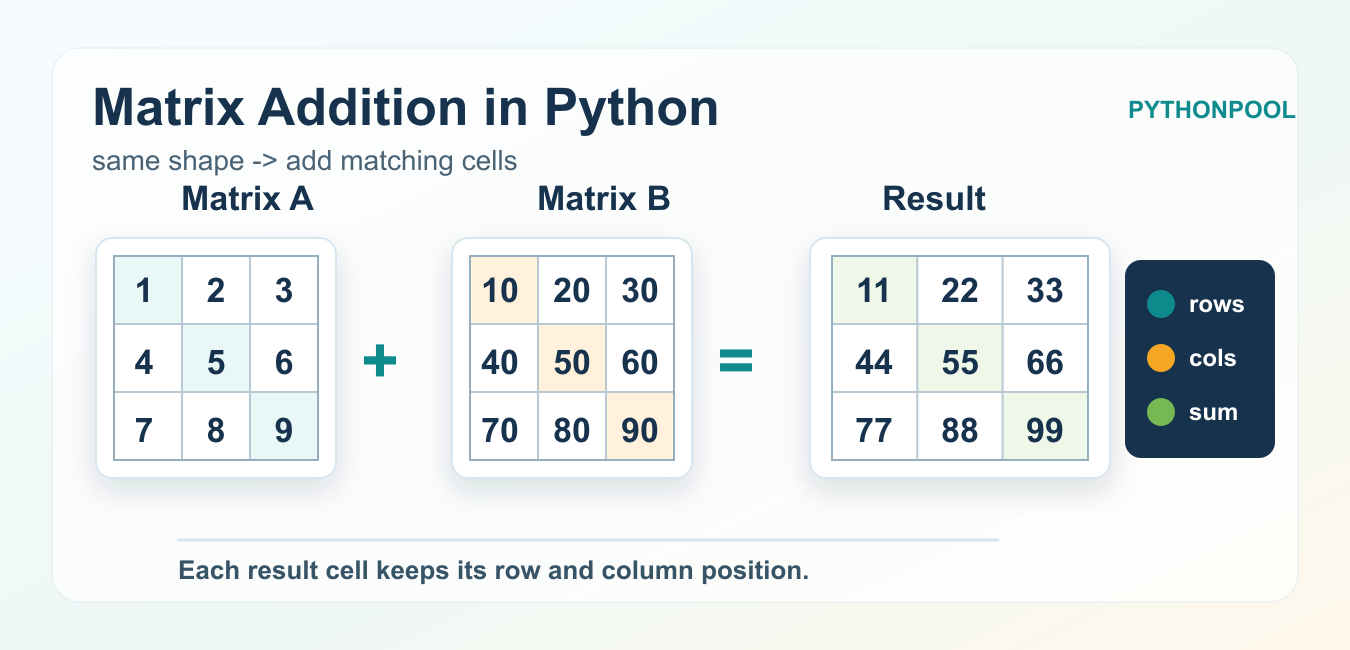
Add matrices in Python with nested lists or NumPy, validate compatible shapes, handle numeric dtypes, and avoid silent broadcasting mistakes.
Browse practical Python tutorials, error fixes, library guides, data science examples, and project ideas from Python Pool.
Add matrices in Python with nested lists or NumPy, validate compatible shapes, handle numeric dtypes, and avoid silent broadcasting mistakes.
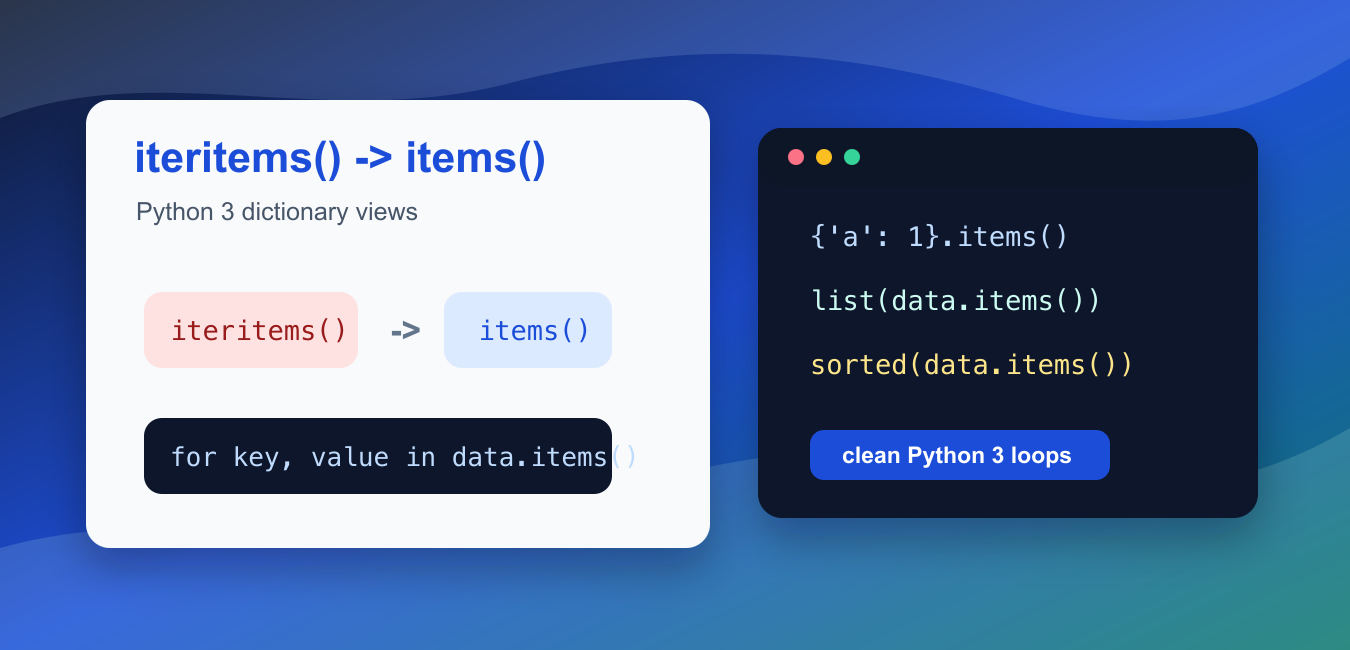
Migrate Python 2 iteritems() calls to Python 3 items(), preserve lazy iteration, and choose list conversion only when a snapshot is required.
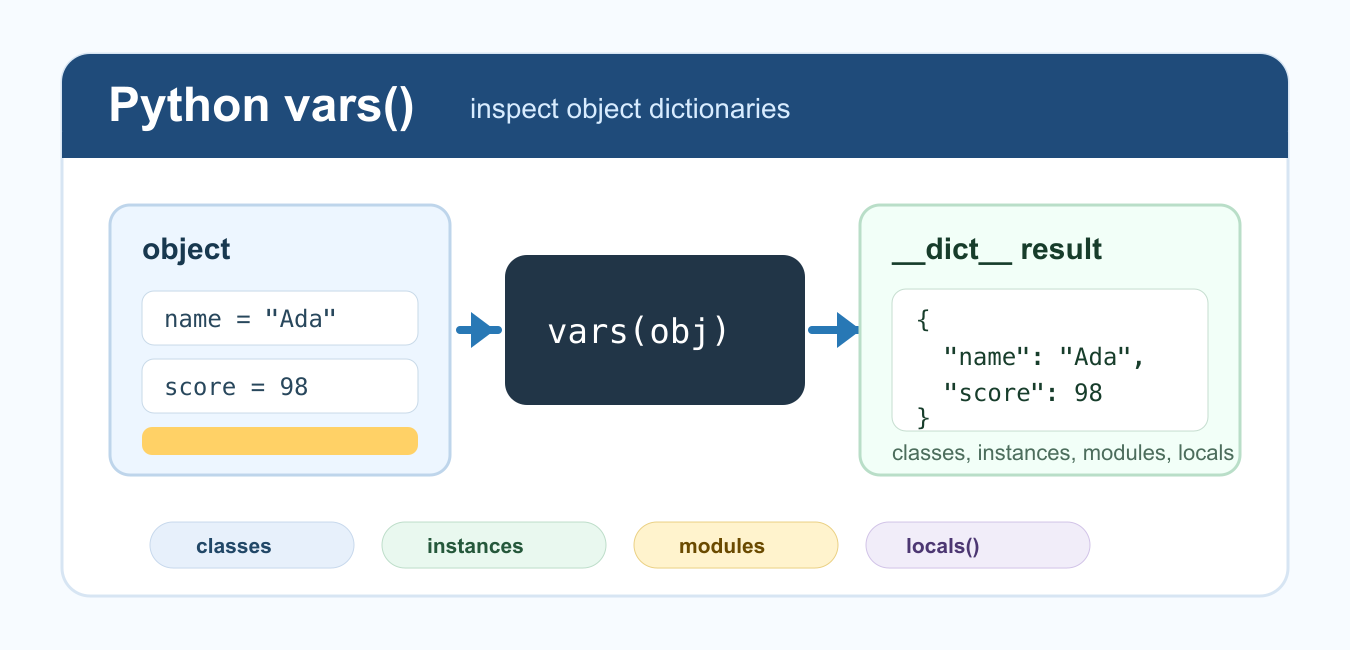
Use Python vars() safely to inspect object attributes and namespaces, understand __dict__, handle objects without it, and avoid mutating state accidentally.
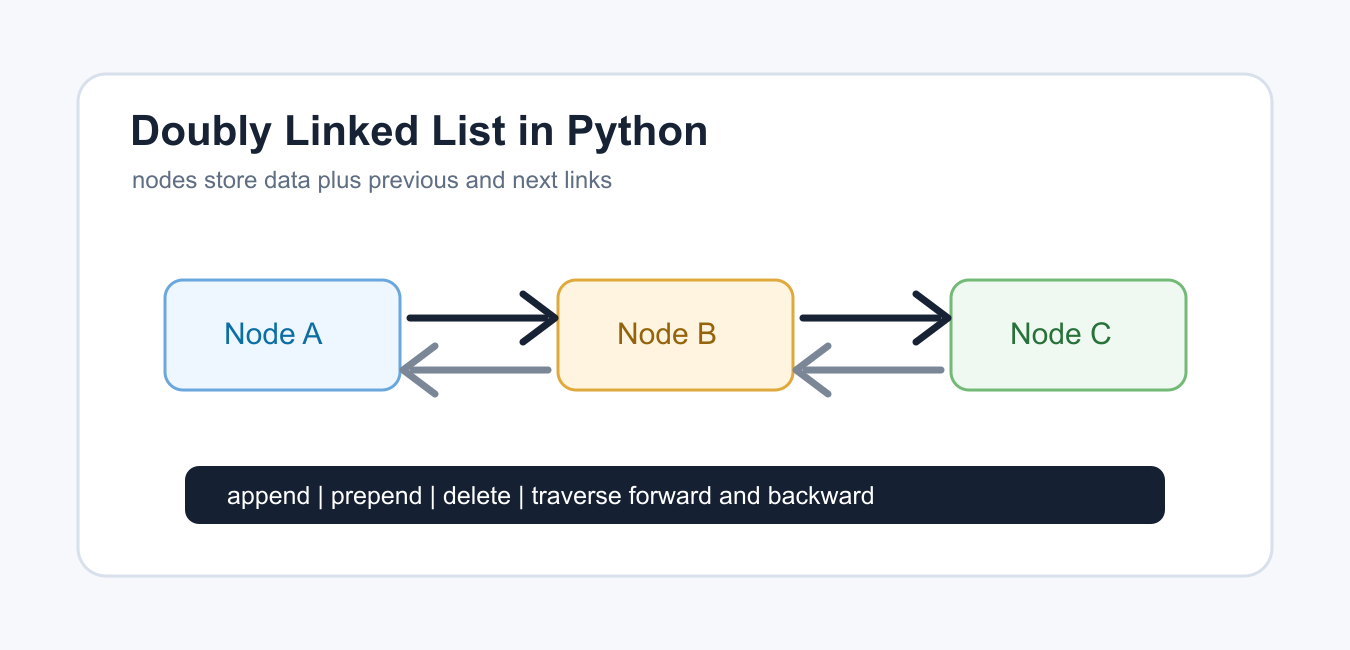
Implement a doubly linked list in Python with previous and next pointers, insertion, deletion, traversal, edge cases, and complexity tradeoffs.
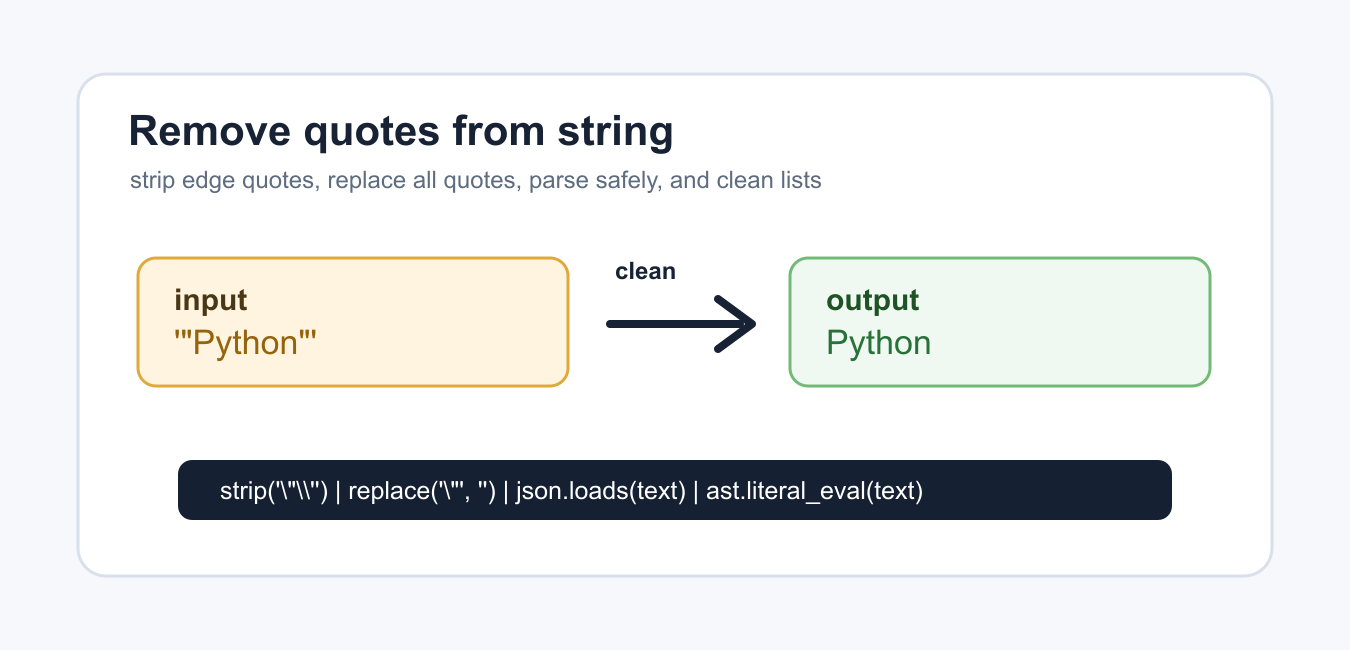
Remove quote characters from Python strings with strip(), replace(), prefix and suffix methods, or safe parsers for structured data.
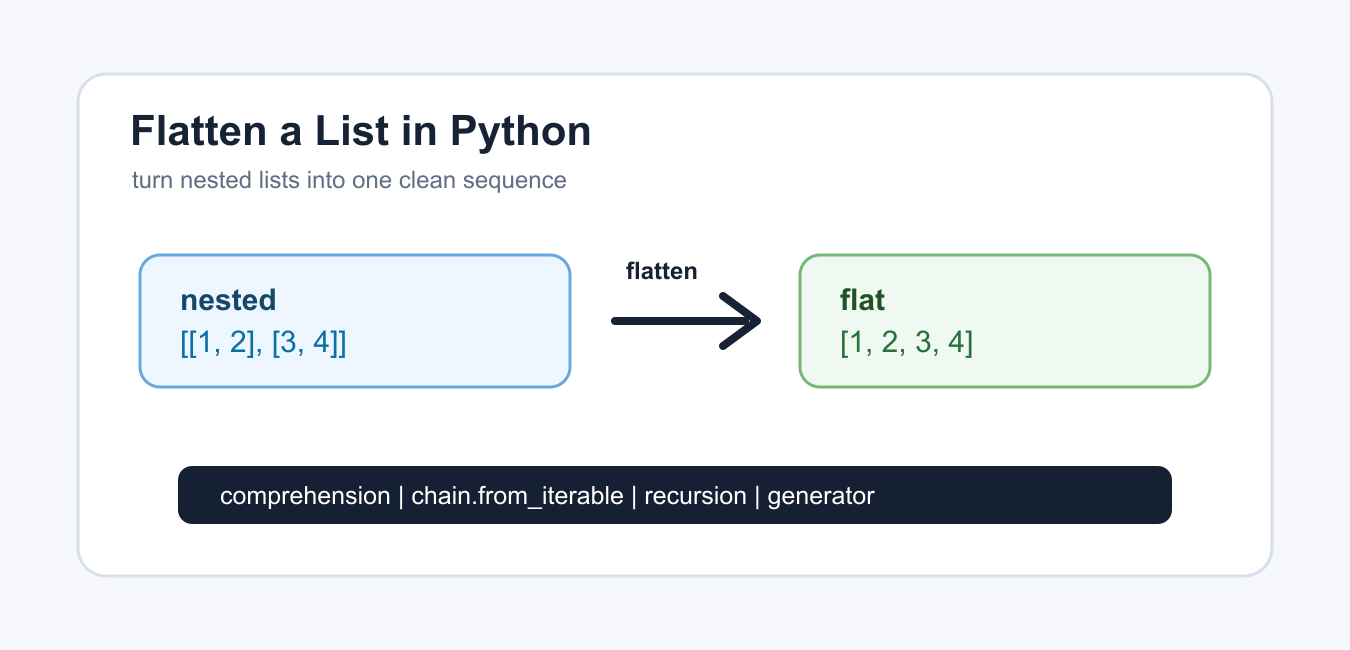
Choose a one-level flatten, chain.from_iterable, or recursive traversal based on the actual nesting and whether strings must remain atomic.
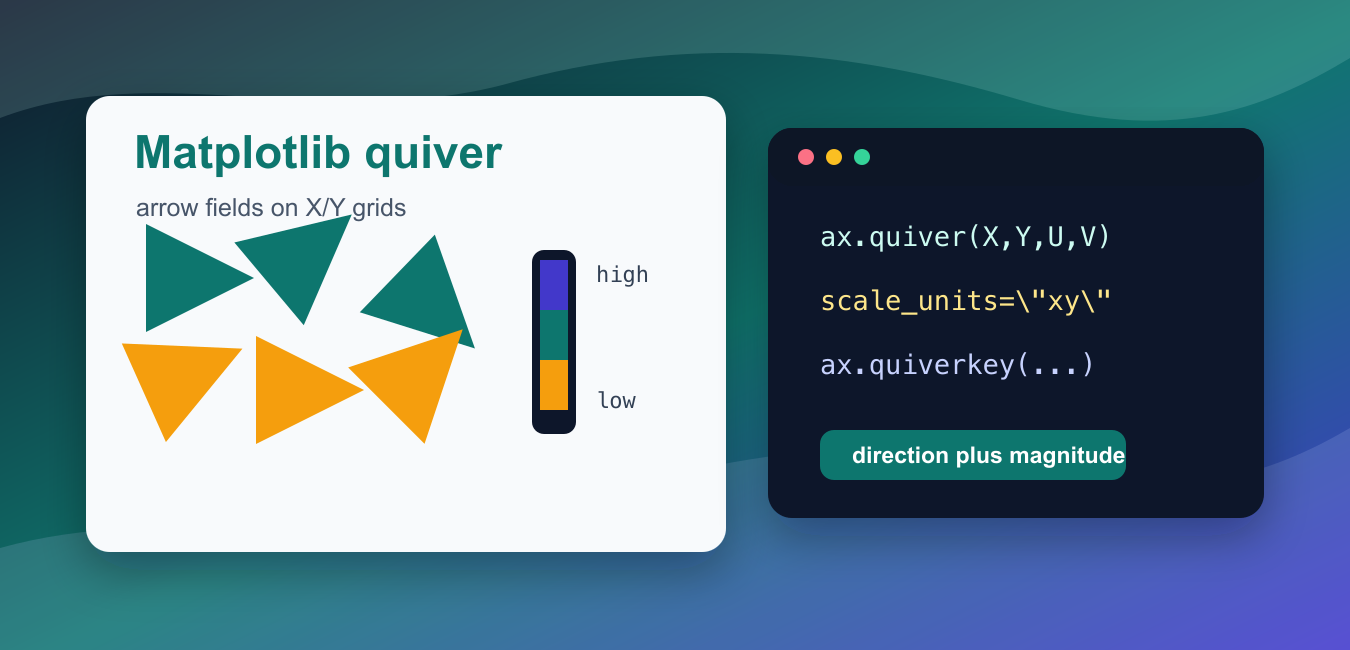
Use Matplotlib quiver() to draw vector fields with correct x-y components, scale, angles, color, grids, and readable arrow keys.
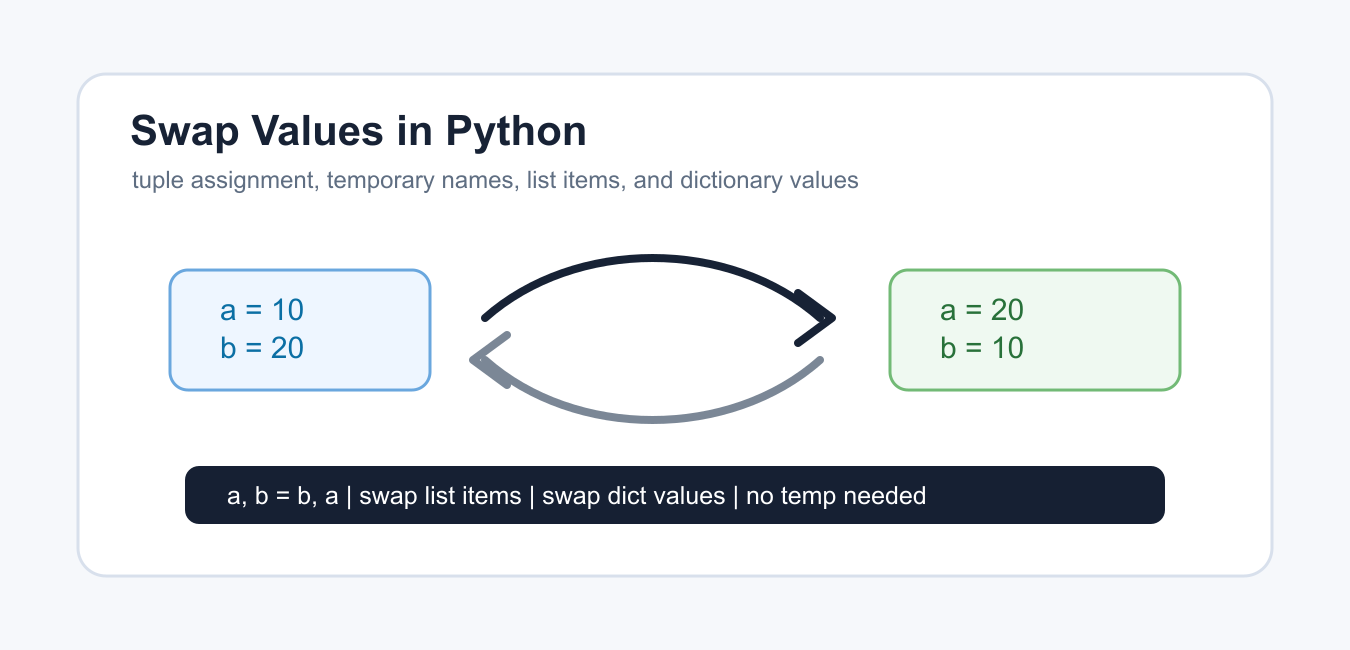
Swap Python variables with tuple assignment, temporary names, list and dictionary updates, and clear guidance for mutable objects.

Use NumPy tanh element-wise on scalars and arrays, understand its range, dtype behavior, broadcasting, overflow warnings, and stable tests.

Use NumPy trace to sum matrix diagonals with offsets and axes, understand rectangular arrays, complex values, dtypes, and equivalent diagonal operations.