Matplotlib GridSpec: Spans, Ratios, and Custom Layouts
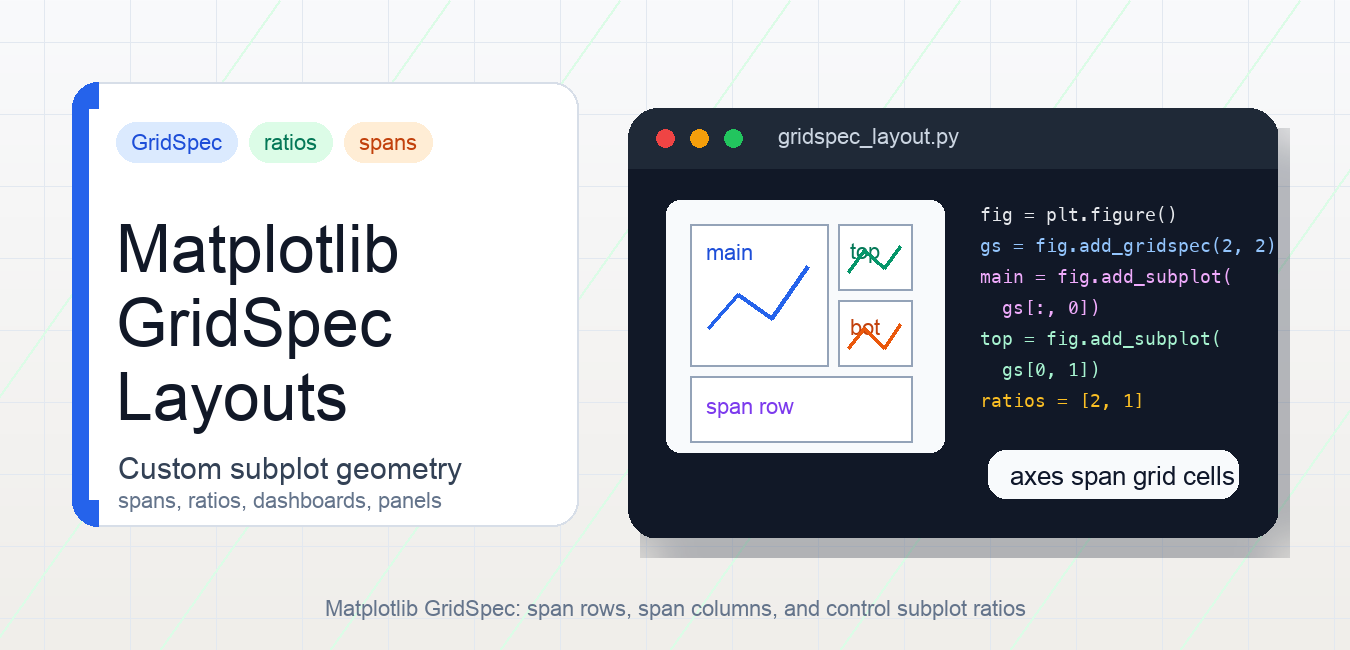
Use Matplotlib GridSpec for subplot spans, width and height ratios, dashboard layouts, colorbars, spacing, and constrained layout.
Browse practical Python tutorials, error fixes, library guides, data science examples, and project ideas from Python Pool.
Use Matplotlib GridSpec for subplot spans, width and height ratios, dashboard layouts, colorbars, spacing, and constrained layout.
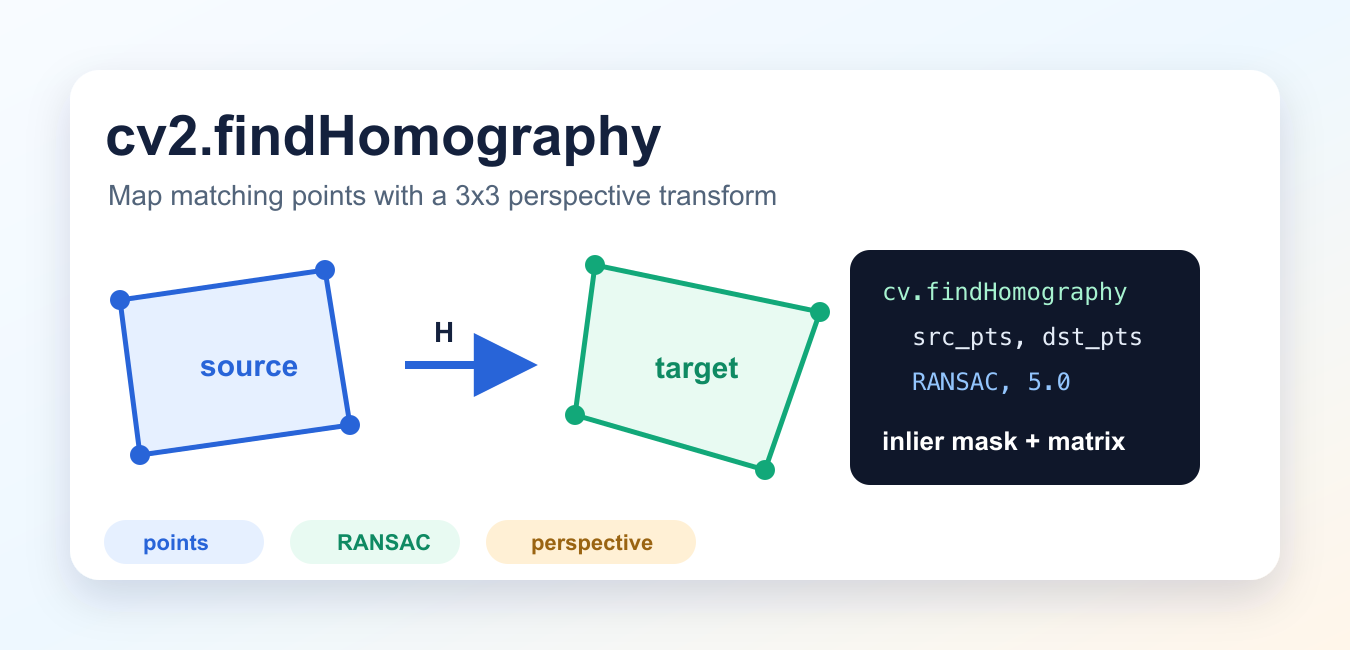
Use cv2.findHomography in Python with matching points, RANSAC, reprojection thresholds, inlier masks, and common matrix errors.
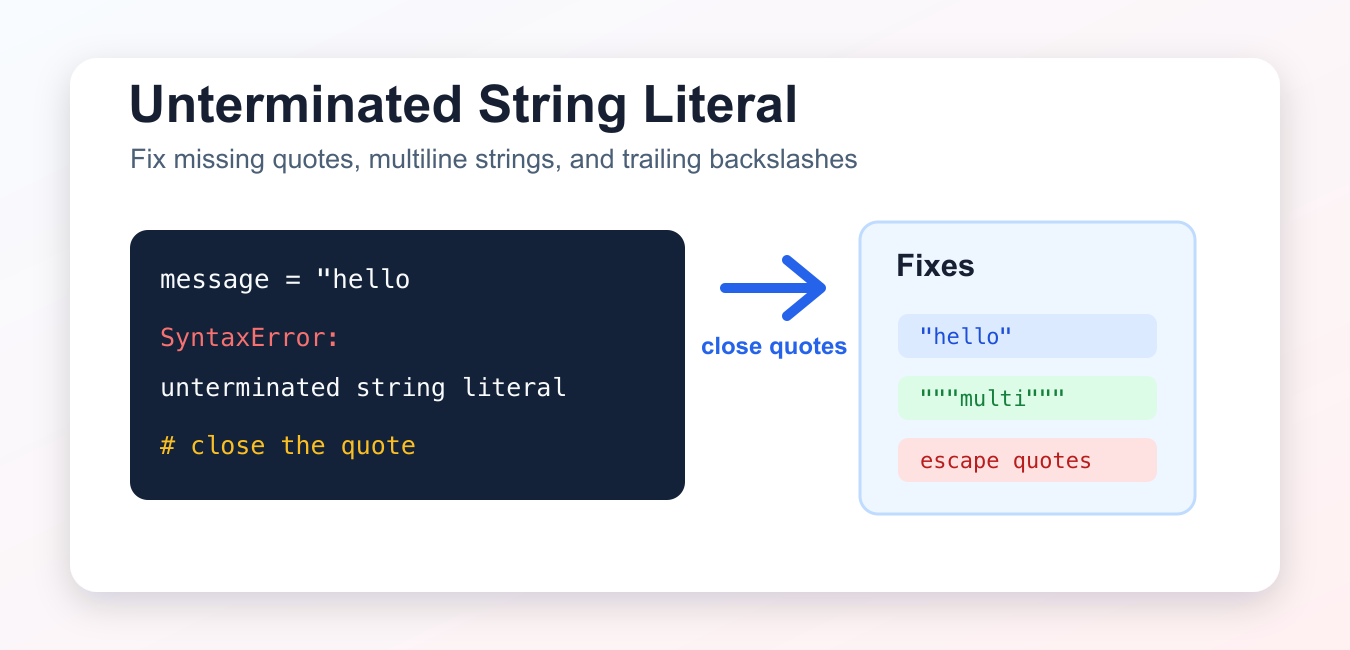
Find the unmatched quote behind an unterminated Python string, then choose correct delimiters, multiline syntax, escapes, or pathlib.
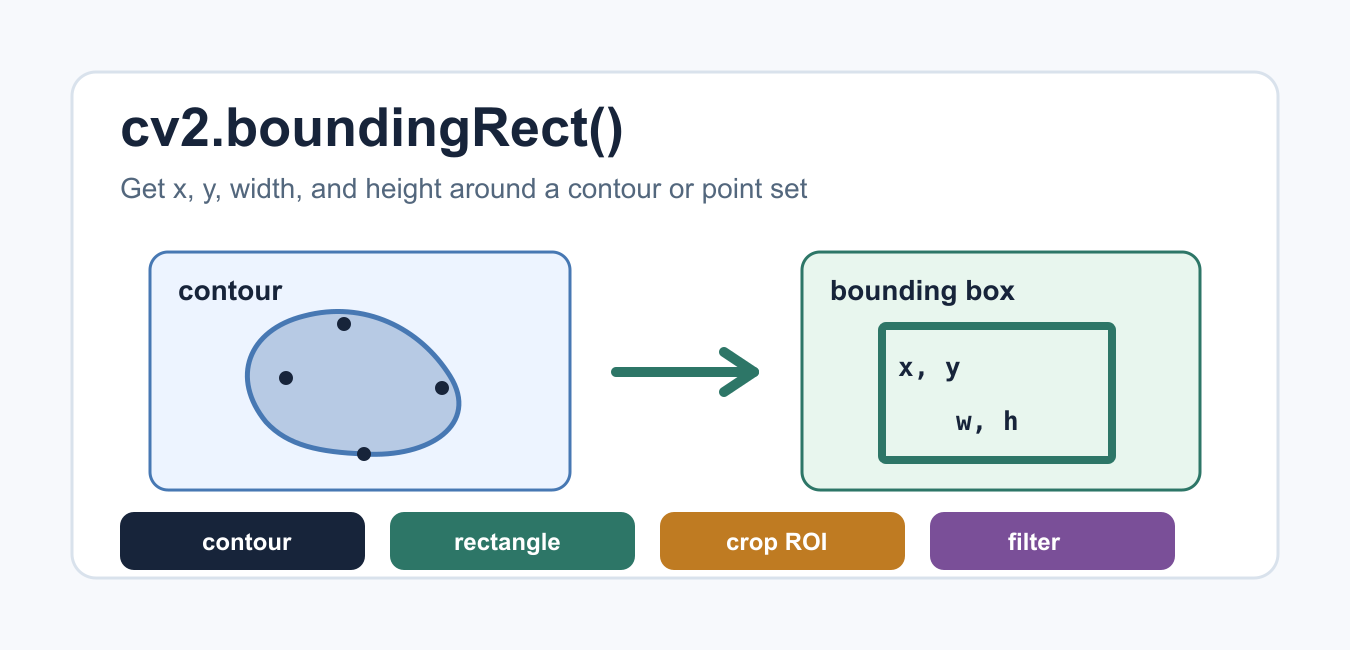
Learn how cv2.boundingRect() returns an upright rectangle as x, y, width, and height, then use it to draw boxes, crop regions, and filter detections.
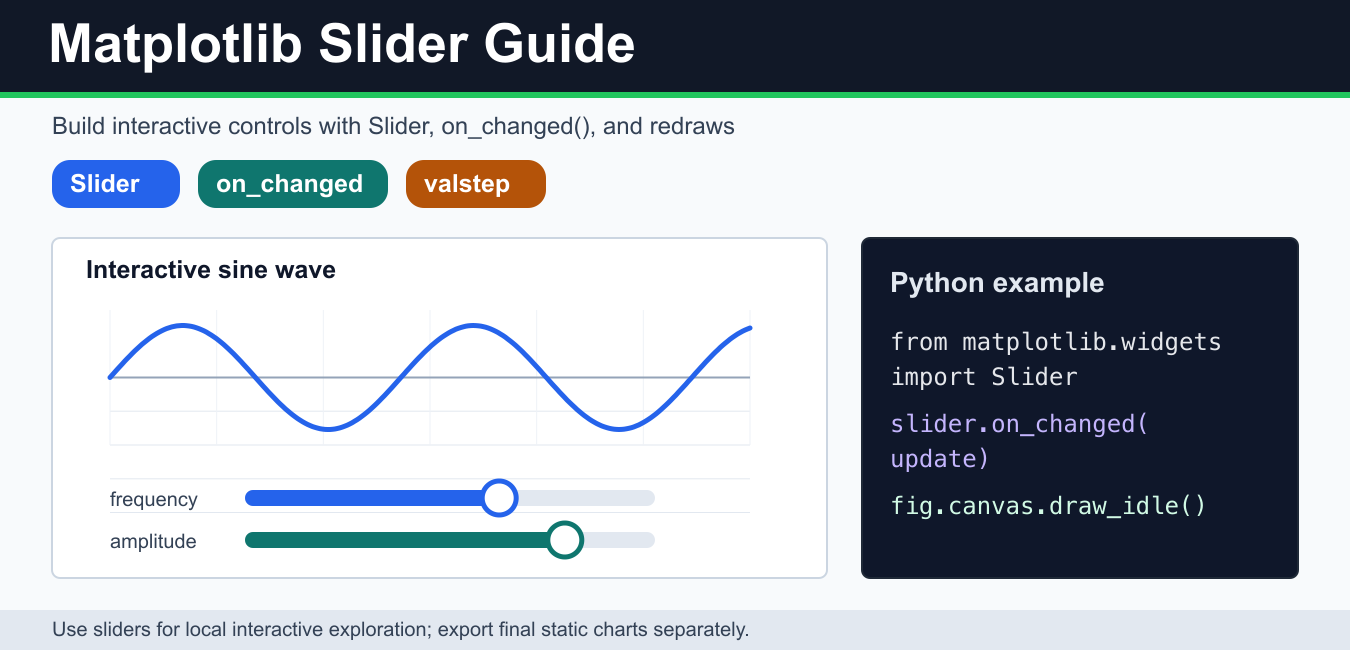
Build an interactive Matplotlib Slider with callbacks, valstep, reset behavior, layout, and backend checks for responsive plot controls.
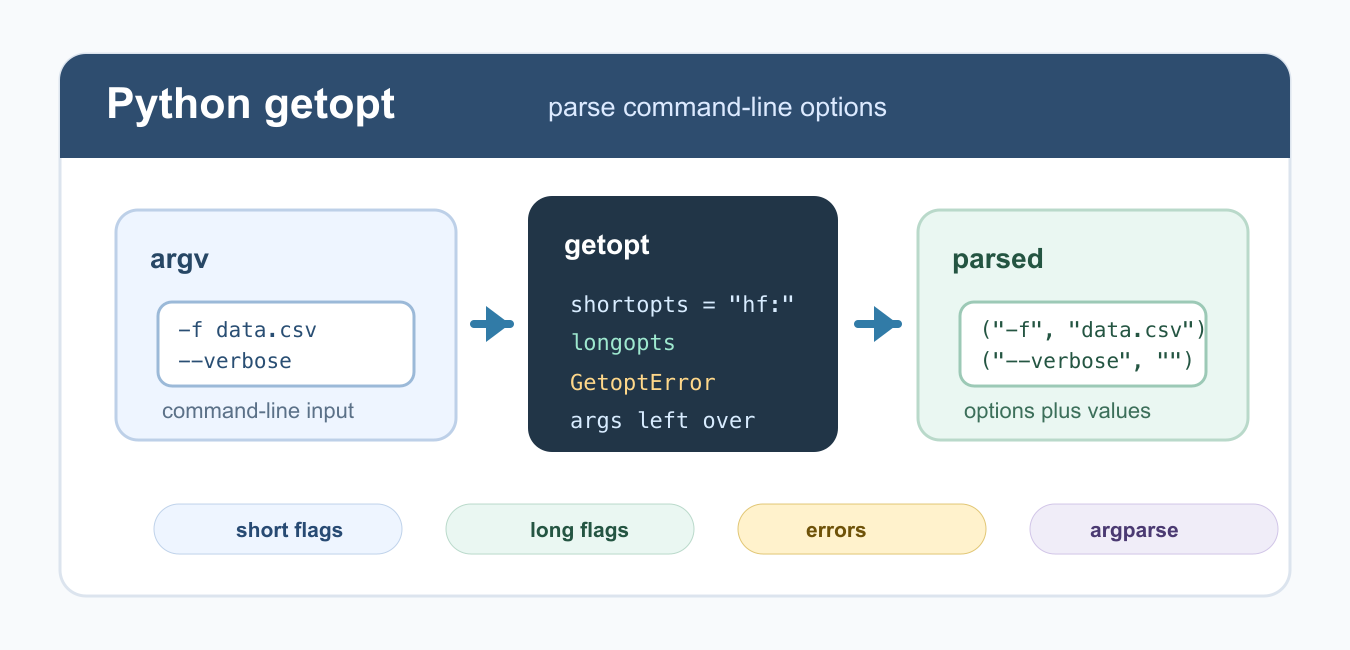
Use Python getopt to parse short and long command-line options, validate required arguments, handle errors, and know when argparse is the better choice.
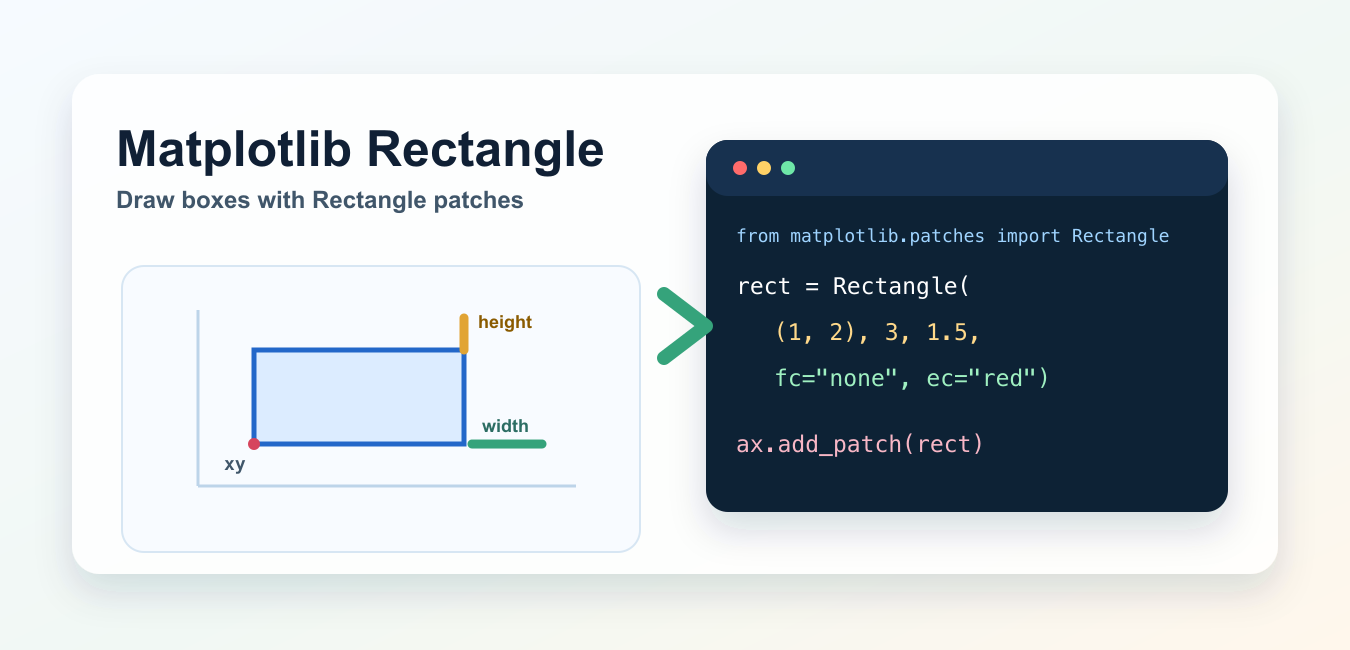
Draw Matplotlib rectangles with Rectangle, add_patch, data coordinates, styling, rotation, image boxes, zorder, and readable limits.
Control Matplotlib plot aspect ratios with set_aspect(), axis(‘equal’), imshow(), set_box_aspect(), and figure sizing.
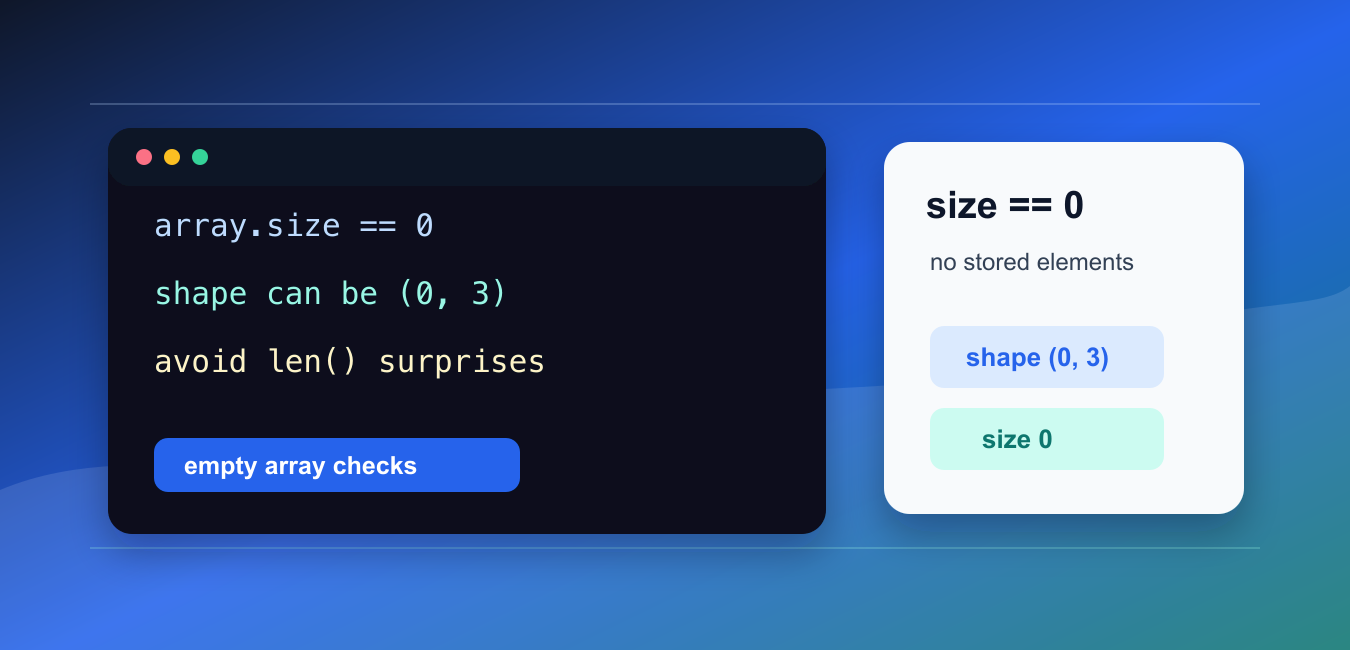
Check whether a NumPy array is empty with size, avoid ambiguous truth-value errors, distinguish zero-size shapes from NaN values, and handle dimensions explicitly.
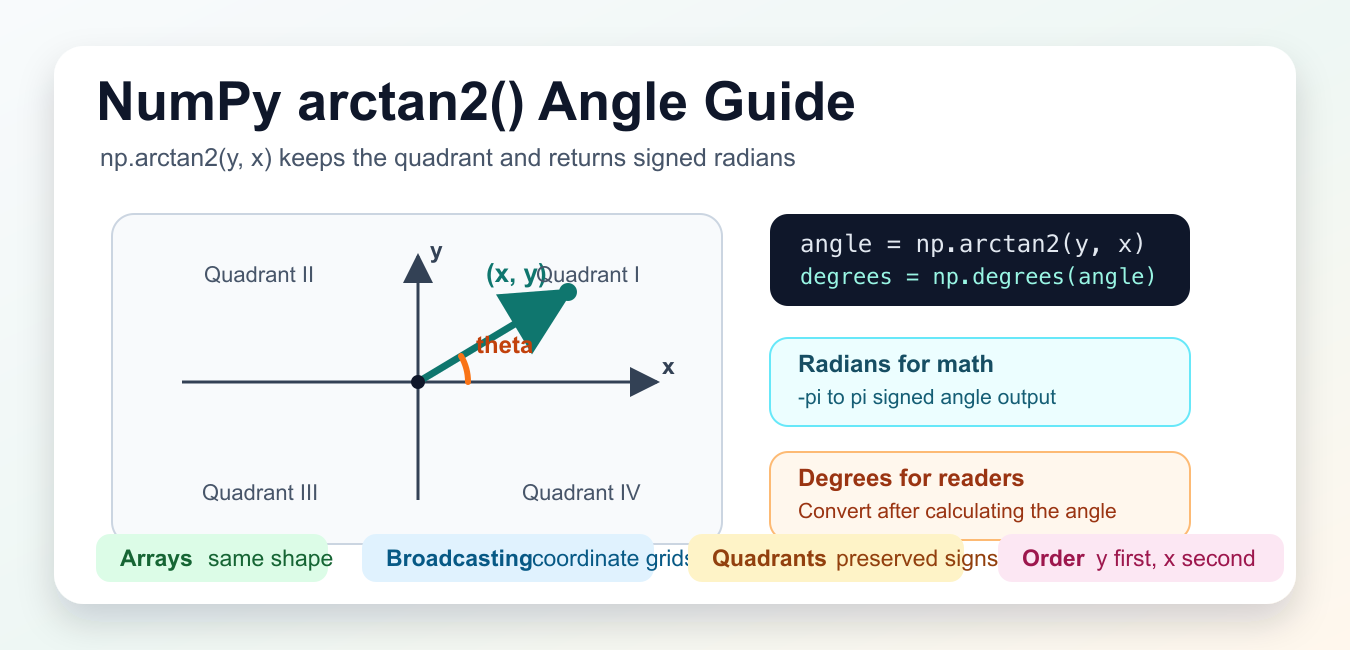
Use NumPy arctan2() for signed angles with correct quadrants, broadcasting, degrees, zero inputs, infinities, and vectorized arrays.