Matplotlib Slider: Interactive Controls, Callbacks, and Reset
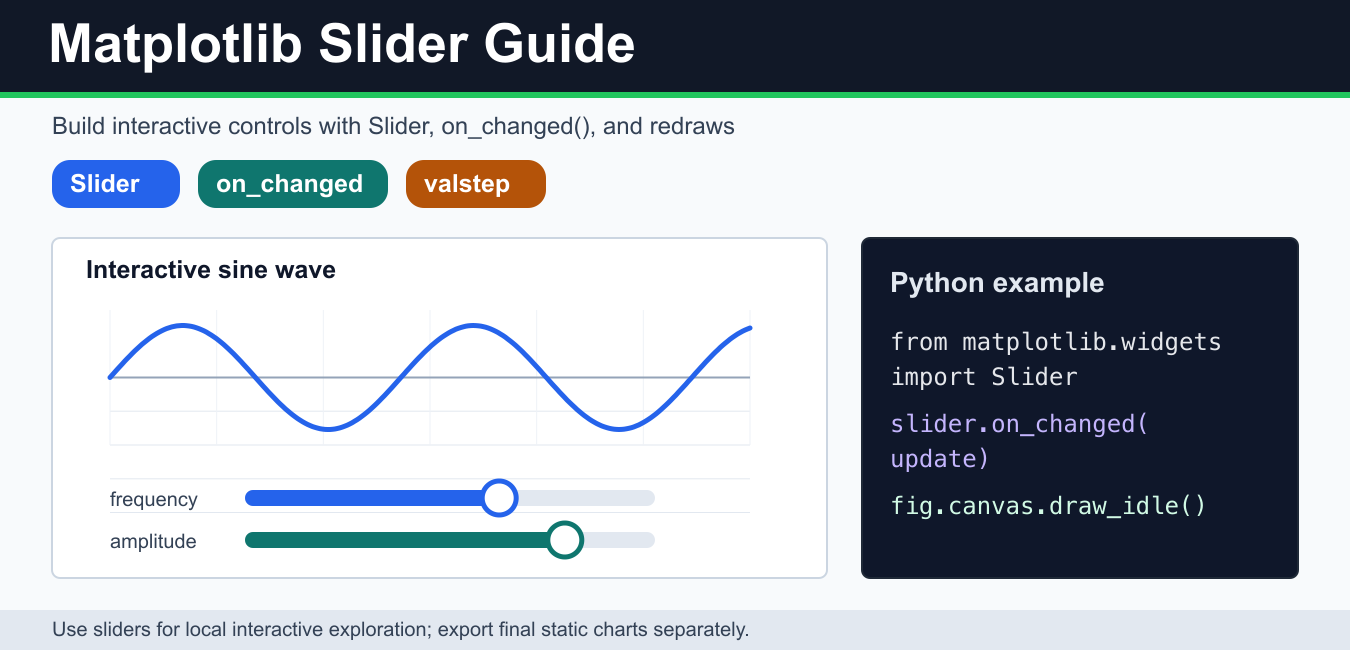
Build an interactive Matplotlib Slider with callbacks, valstep, reset behavior, layout, and backend checks for responsive plot controls.
Learn Matplotlib with tutorials for plots, labels, grids, colors, figures, legends, annotations, exports, and visualization examples in Python.
Build an interactive Matplotlib Slider with callbacks, valstep, reset behavior, layout, and backend checks for responsive plot controls.
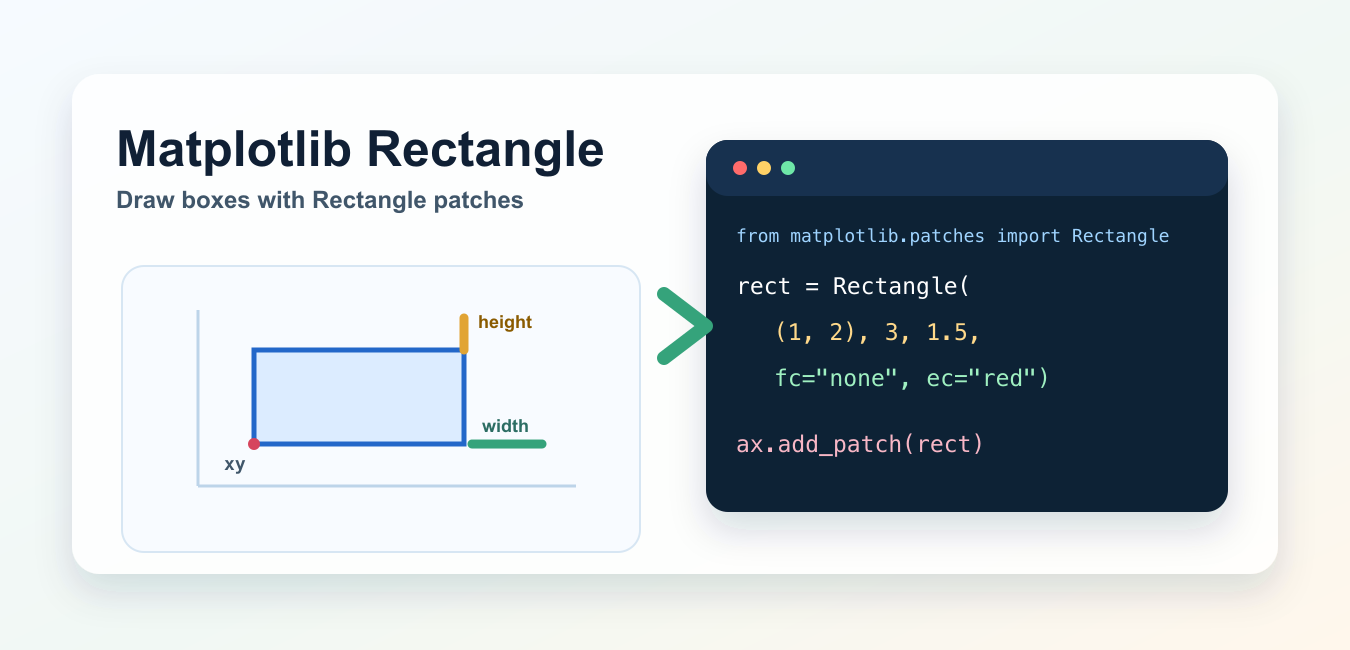
Draw Matplotlib rectangles with Rectangle, add_patch, data coordinates, styling, rotation, image boxes, zorder, and readable limits.
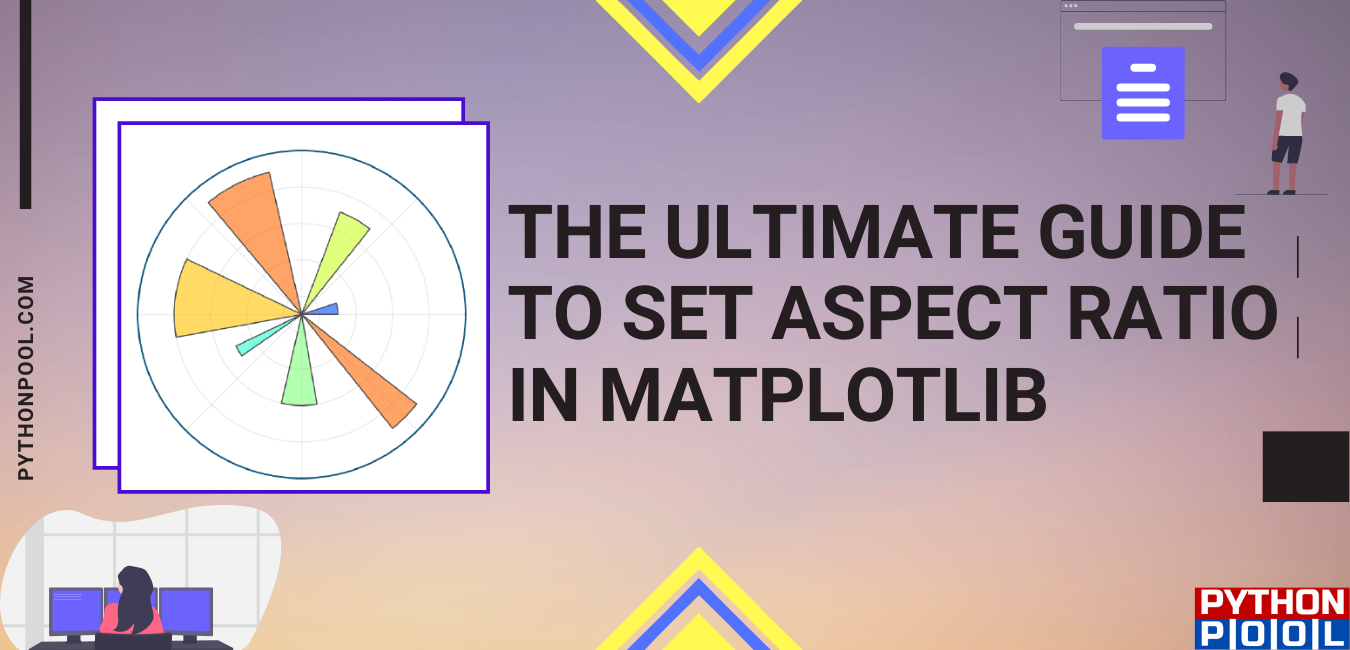
Control Matplotlib plot aspect ratios with set_aspect(), axis(‘equal’), imshow(), set_box_aspect(), and figure sizing.
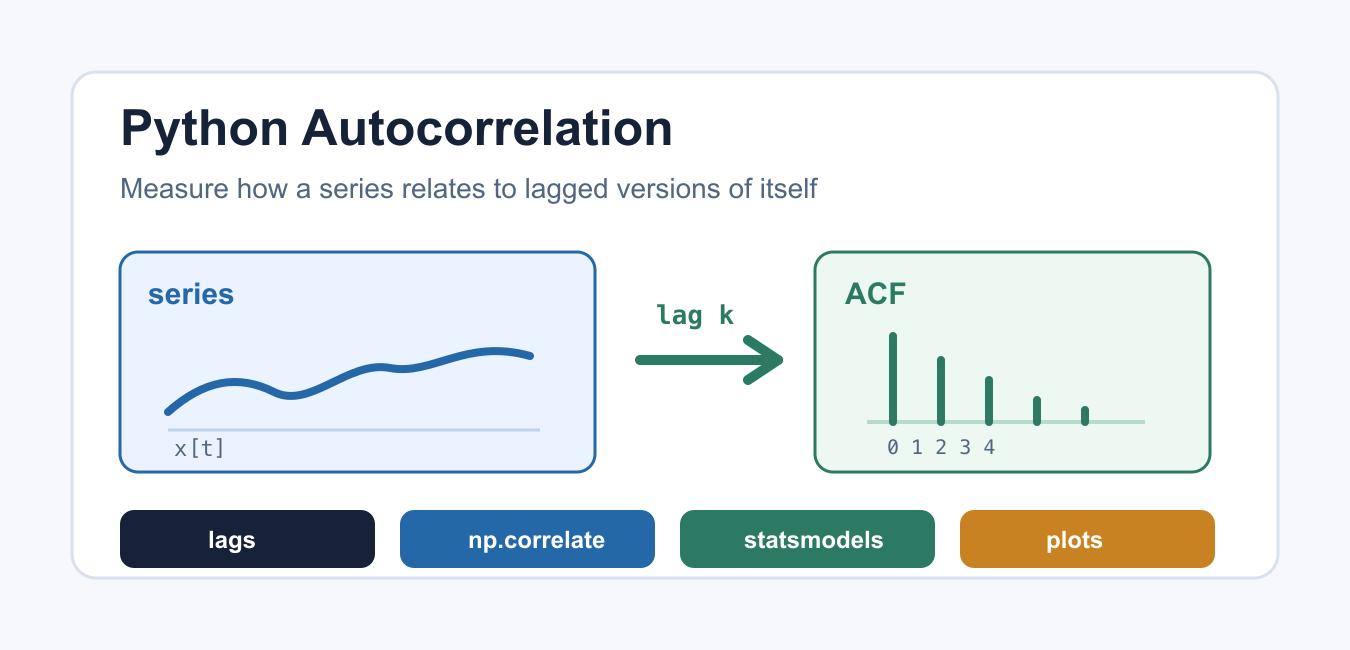
Compute autocorrelation in Python with centered series, lag conventions, missing values, normalization, confidence limits, and time-series checks.
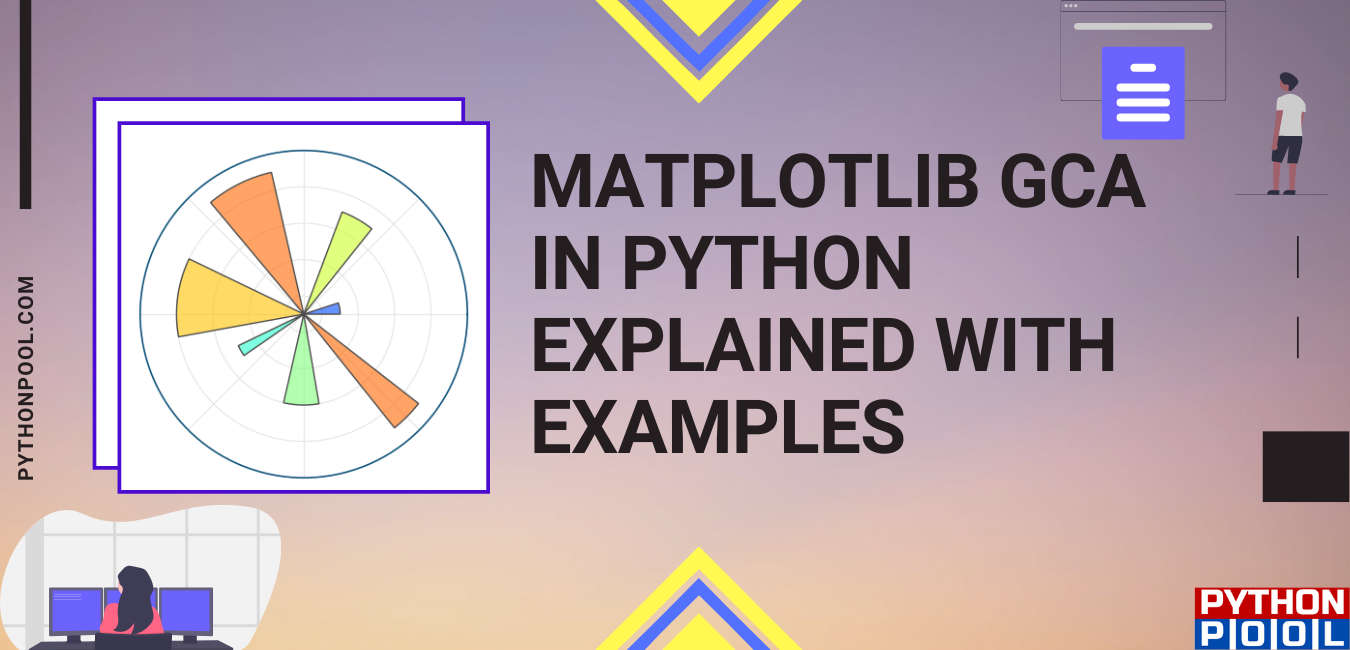
Understand matplotlib.pyplot.gca(), current Axes state, gca() versus gcf(), and why explicit subplots are clearer in new code.
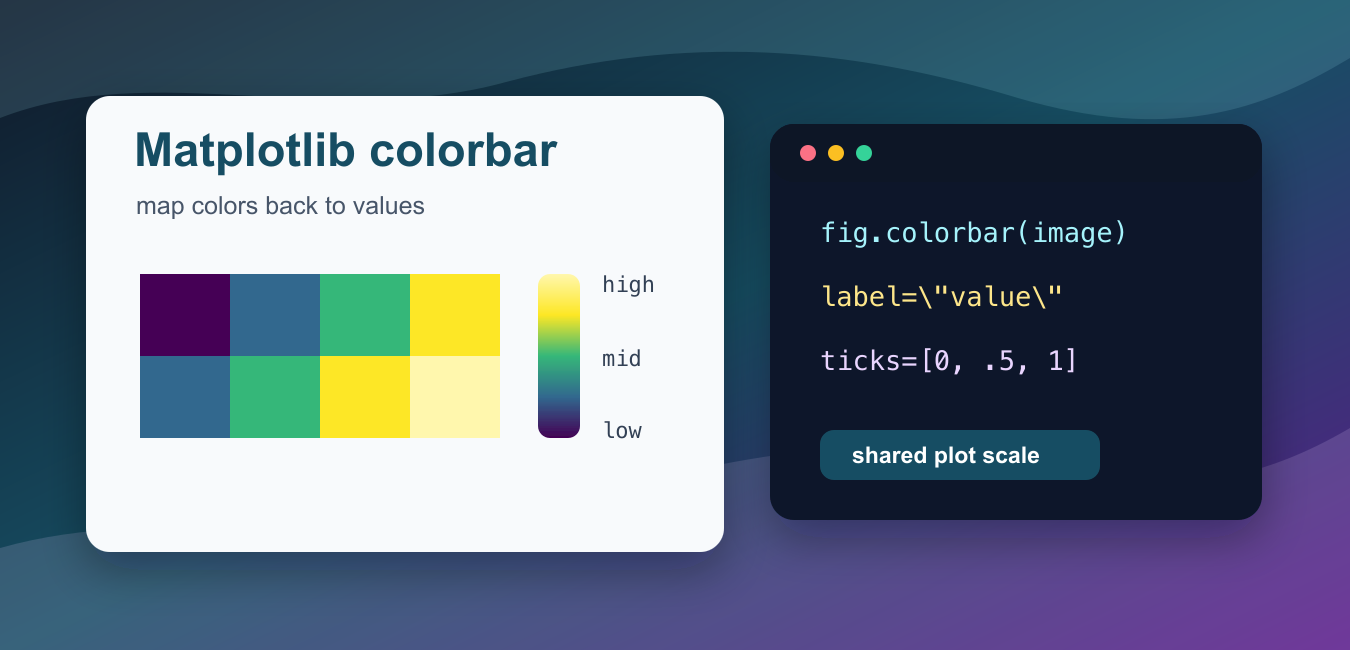
Create an honest Matplotlib colorbar by connecting it to a mappable, controlling cmap and norm, sharing scales, and managing layout.

Fix Matplotlib subplot spacing with tight_layout, constrained layout, subplots_adjust, and GridSpec without clipped labels or overlapping axes.
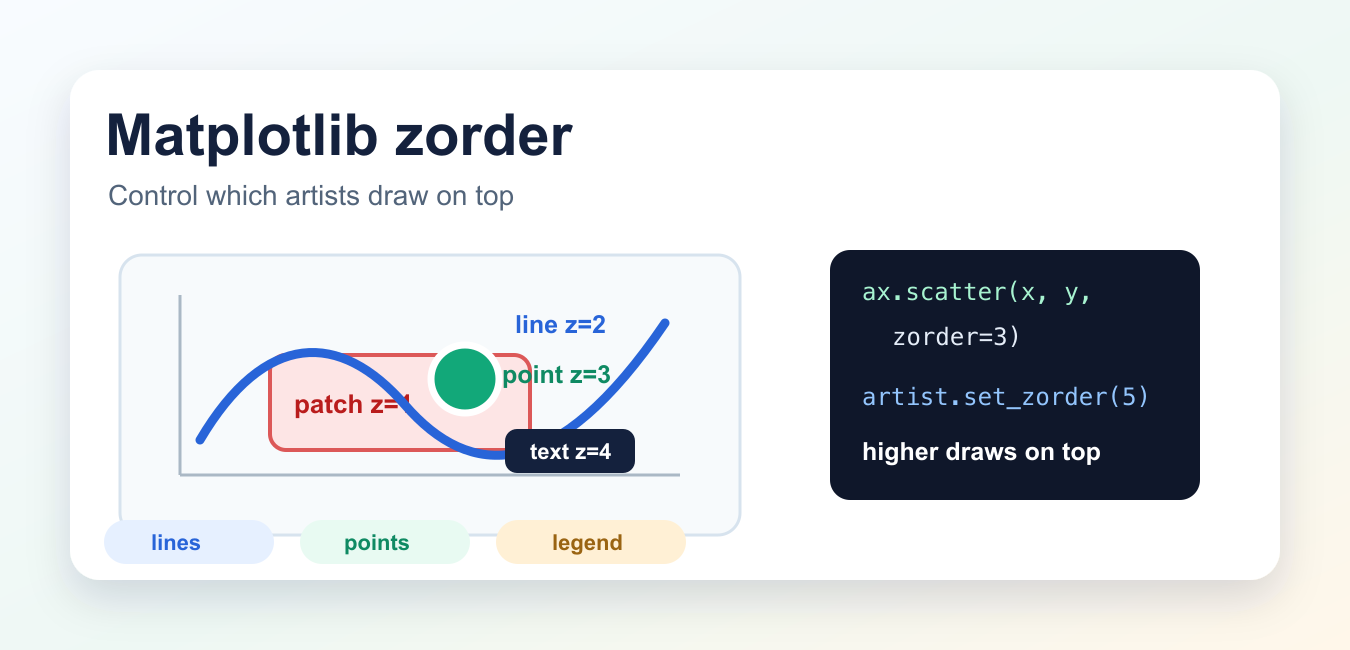
Control which Matplotlib artists appear in front with zorder, including grids, patches, lines, text, annotations, and legends.
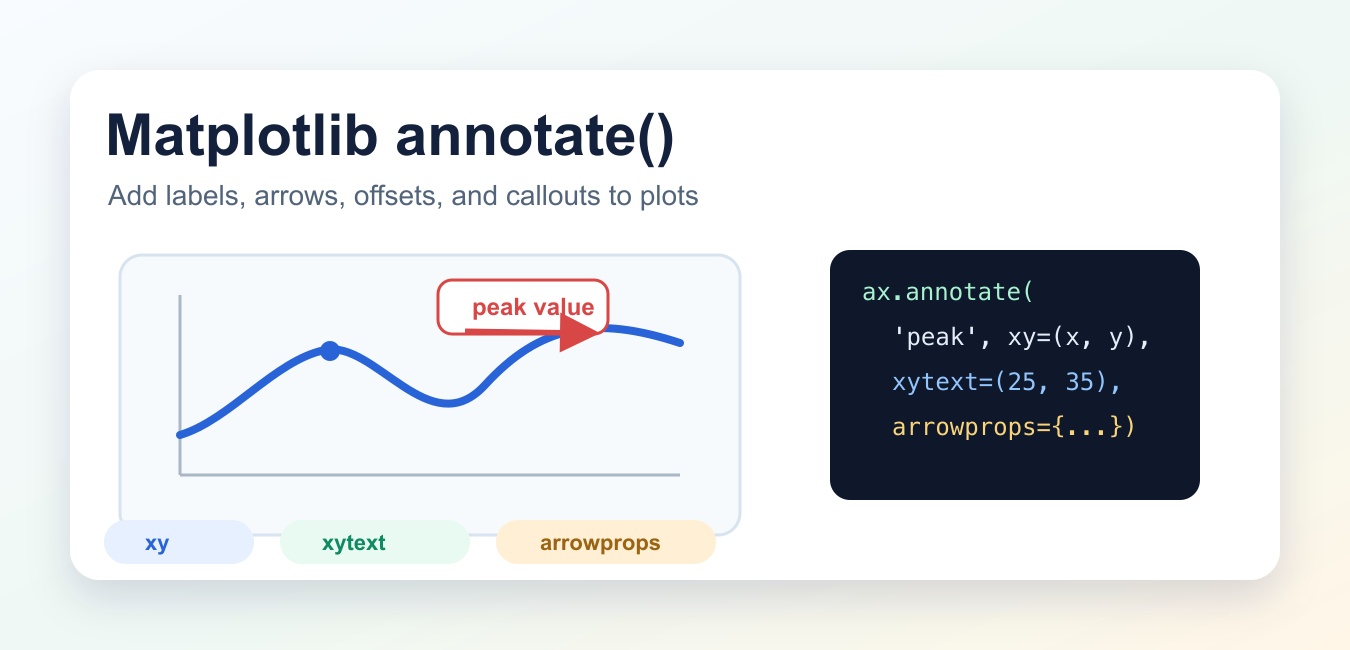
Use Matplotlib annotate() with xy, xytext, arrows, coordinate systems, boxed labels, clipping, and readable exported plots.
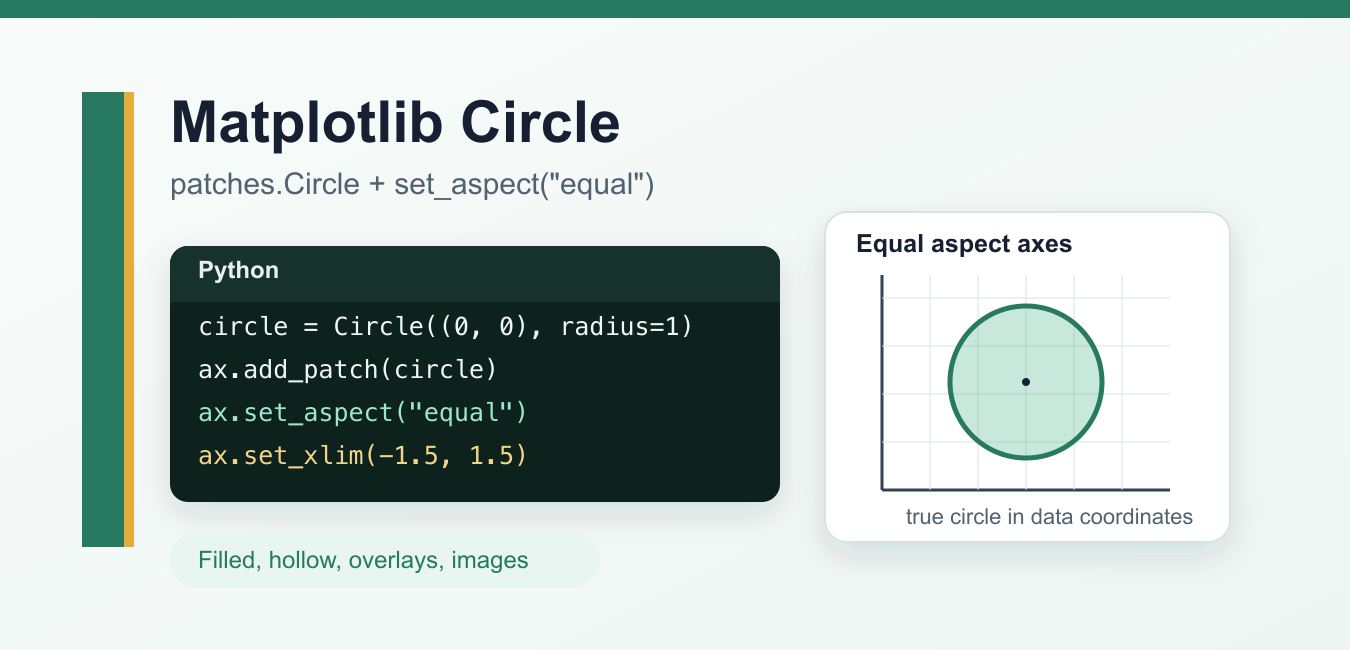
Draw true Matplotlib circles with patches.Circle, equal aspect ratio, hollow outlines, labels, and saved figures without distorted geometry.