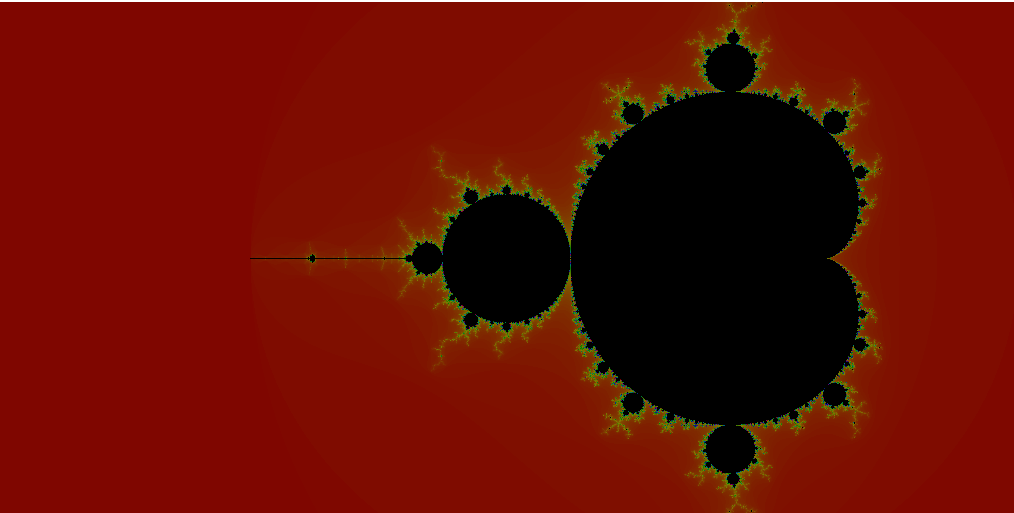
In this article, we are going to learn about how to generate Mandelbrot set in Python. This is one of the beautiful objects in Mathematics. In the Mandelbrot set, there is an infinite amount of beautiful shapes and patterns. Now let us learn about it in a detailed manner. And also how to generate Mandelbrot set in Python.
The Mandelbrot set is the most beautiful pattern. It is a three-dimensional pattern. Spherical coordinates are used to construct this set. We are going to print two Mandelbrot set using python libraries. Using iteration to print this set of patterns.
Formula to generate the Mandelbrot set

We can see the formula for the Mandelbrot set in the above image. This is a type of set that is commonly called fractal. The Mandelbrot set is calculated in the number systems of complex numbers.
Iteration of the Mandelbrot set
The Mandelbrot set is generated iteration. Iteration means repeating the process again and again. In mathematics, the iteration process is the most often application of the mathematical function. The function involved in the Mandelbrot set is straightforward. They are quadratic polynomials. The form of a quadratic polynomial is f(y) = y2 + k, where k is a constant number.
First, we iterate y2+k. Now we can write this number as y0. We will apply the function we have y2+k to y0 we will get the new number.
y1 = y20 + k.
Now we will follow the same in this too now we will get
y2 = y21 + k
The iteration is now,
y3 = y22 + k
The value becomes,
y4 = y23 + k
and it goes on. The numbers y1, y2….. are the orbit of y0 under an iteration of y2+k.
The Mandelbrot set contains all complex values for which the corresponding orbit of 0 under y2+k. Mandelbrot set is represented by the letter M. The name Mandelbrot is came by Benoit Mandelbrot. He is the first person to study the set.
For example:
If we take k is equal to one, the sequence of the Mandelbrot set is zero, one, two, five, twenty-six, and it goes on and becomes infinity. So one is not an element of the Mandelbrot set. If we take -1 the sequence is 0, -1, 0, 0, -1 and at last it becomes -1.
Generating the Mandelbrot set in Python in a form of image Method 1
from numpy import complex, array
from PIL import Image
import colorsys
width_of_the_set = 1000
Importing the necessary libraries, we want to generate the given set. The necessary libraries are NumPy, PIL, and colorsys. From NumPy importing complex and array. And from PIL importing image so that it will display the set in image format. Importing colorsys. After importing the libraries, we are setting the width of the set as 1000.
def color(i):
    color_of_the_set = 255 * array(colorsys.hsv_to_rgb(i / 245.0, 0.9, 0.4))
    return tuple(color_of_the_set.astype(int))
Now create a function named color. This function is for colors. Giving the colors as an integer value in the form of RGB. Next to return the tuple to print the colors of the set.
def mandelbrot_set(x, y):
    c1 = complex(x, y)
    c2 = 0
    for n in range(1, 900):
        if abs(c2) > 2:
            return color(n)
        c2 = c2 * c2 + c1
    return (0, 0, 0)
Creating another function named mandelbrot_set. A Variable c1 holds the complex numbers, and c2 is equal to zero. Using for loop to iterate till the given value. Now using the if statement to check the condition. If the condition is True, the corresponding color will be generated.
image = Image.new('RGB', (width_of_the_set, int(width_of_the_set / 2)))
pixels = image.load()
for x in range(image.size[0]):
    print("%.2f %%" % (x / width_of_the_set * 100.0))
    for y in range(image.size[1]):
        pixels[x, y] = mandelbrot_set((x - (0.75 * width_of_the_set)) / (width_of_the_set / 4),(y - (width_of_the_set / 4)) / (width_of_the_set / 4))
image.show()
Creating another for loop and is useful for image size. Using nested for loop to iterate the size of the image. The last statement image.show() is useful to print the image.
Entire code : Method 1
from numpy import complex, array
from PIL import Image
import colorsys
width_of_the_set = 1000
def color(i):
    color_of_the_set = 255 * array(colorsys.hsv_to_rgb(i / 245.0, 0.9, 0.4))
    return tuple(color_of_the_set.astype(int))
def mandelbrot_set(x, y):
    c1 = complex(x, y)
    c2 = 0
    for n in range(1, 900):
        if abs(c2) > 2:
            return color(n)
        c2 = c2 * c2 + c1
    return (0, 0, 0)
image = Image.new('RGB', (width_of_the_set, int(width_of_the_set / 2)))
pixels = image.load()
for x in range(image.size[0]):
    print("%.2f %%" % (x / width_of_the_set * 100.0))
    for y in range(image.size[1]):
        pixels[x, y] = mandelbrot_set((x - (0.75 * width_of_the_set)) / (width_of_the_set / 4),
                                      (y - (width_of_the_set / 4)) / (width_of_the_set / 4))
image.show()
Output

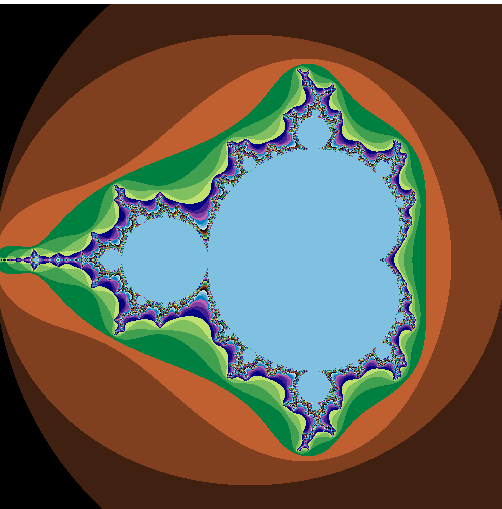
Generating the Mandelbrot set in Python in a form of image Method 2
from PIL import Image
x1 = -2.0
x2 = 1.0
y1 = -1.5
y2 = 1.5
max_iterations = 255
image_of_x = 512
image_of_y = 512
image = Image.new("RGB", (image_of_x, image_of_y))
Importing a library PIL. From PIL importing image. The output is in the form of the image, so importing the image. Initializing the values of x1, x2, y1, and y2. Giving the maximum iterations as 255. The image of the x and y is 512.
for y in range(image_of_y):
    zy = y * (y2- y1) / (image_of_y - 1)  + y1
    for x in range(image_of_x):
        zx = x * (x2 - x1) / (image_of_x - 1)  + x1
        z = zx + zy * 1j
        c = z
        for i in range(max_iterations):
            if abs(z) > 2.0: break
            z = z * z + c
        image.putpixel((x, y), (i % 4 * 64, i % 8 * 32, i % 16 * 16))
image.show()
Creating for loop to iterate. The first for loop is for the image of y, and the other is an image of x. Another for loop is for maximum iterations. Image.show() is useful to display the output in the image form.
Entire Code: Method 2
from PIL import Image
x1 = -2.0
x2 = 1.0
y1 = -1.5
y2 = 1.5
max_iterations = 255
image_of_x = 512
image_of_y = 512
image = Image.new("RGB", (image_of_x, image_of_y))
for y in range(image_of_y):
    zy = y * (y2- y1) / (image_of_y - 1)  + y1
    for x in range(image_of_x):
        zx = x * (x2 - x1) / (image_of_x - 1)  + x1
        z = zx + zy * 1j
        c = z
        for i in range(max_iterations):
            if abs(z) > 2.0: break
            z = z * z + c
        image.putpixel((x, y), (i % 4 * 64, i % 8 * 32, i % 16 * 16))
image.show()
Output

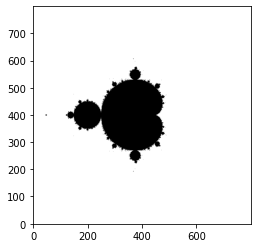
Printing the Mandelbrot Set in a form of Graph
from pylab import imshow,show,gray
from numpy import zeros,linspace
i=800
j = zeros([i,i],int)
value_of_x = linspace(-2,2,i)
value_of_y= linspace(-2,2,i)
for m,x in enumerate(value_of_x):
    for n,y in enumerate(value_of_y):
        complex_number = 0 + 0j
        z = complex(x,y)
        for i in range(100):
            complex_number   = complex_number *complex_number  + z
            if abs(complex_number) > 2.0:
                j[n,m] = 1
                break
imshow(j,origin="lower")
gray()
show()
Importing the necessary libraries. From pylab importing imshow, gray, and show. Zeros and linspace from numpy library. Giving the value of the graph as 800. for loop is useful to iterate. Initialized a complex number as 0+0j. Another for loop is to iterate complex_number. The abs() is useful for roundoff the values, at last using break statement to terminate the loop.
Output

Frequently Asked Questions Related to Mandelbrot Set in Python
Mandelbrot is a set of complex numbers that the functions that do not diverge when iterated from z are equal to zero.
Yes, the Mandelbrot set is a three-dimensional object.
The equation for the Mandelbrot set is zn+1 = zn2 + c.
Conclusion
In this article, we learned about how to generate Mandelbrot set fractals in python. This set is one of the beautiful and interesting sets in mathematics. And this is very easy to understand. We hope that this article is beneficial for you.
