Matplotlib Pie Chart Custom and Nested in Python

In this article, we will discuss the Matplotlib Pie chart in Python. A Pie Chart is a circular statistical plot used to display only one …
In this article, we will discuss the Matplotlib Pie chart in Python. A Pie Chart is a circular statistical plot used to display only one …

In this article, we will discuss Matplotlib Linestyle in Python. The Matplotlib library of Python is used for data visualization due to its wide variety …

Hello programmers, in today’s article, we will discuss Matplotlib Boxplot in Python.A Box Plot is a Whisker plot in simpler terms. Box plots are created …
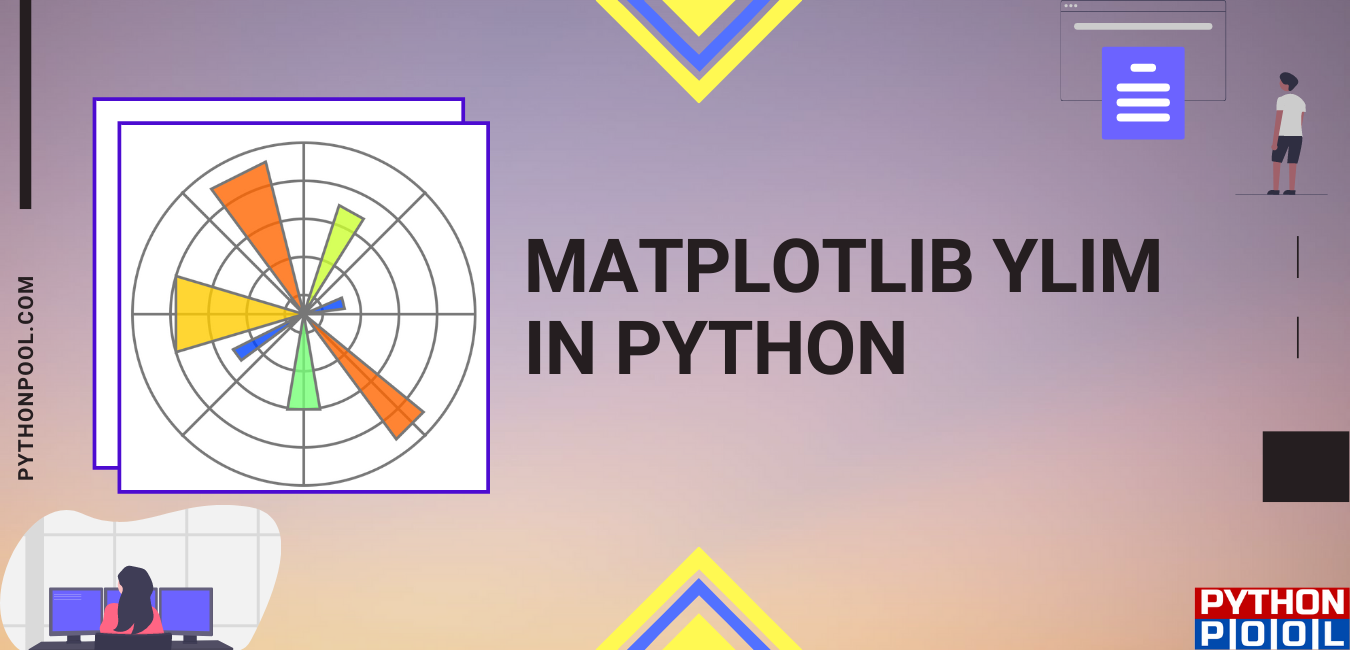
Hello programmers, in today’s article, we will discuss the Matplotlib ylim() in Python. The Matplotlib library in Python is a numerical – mathematical extension for the …
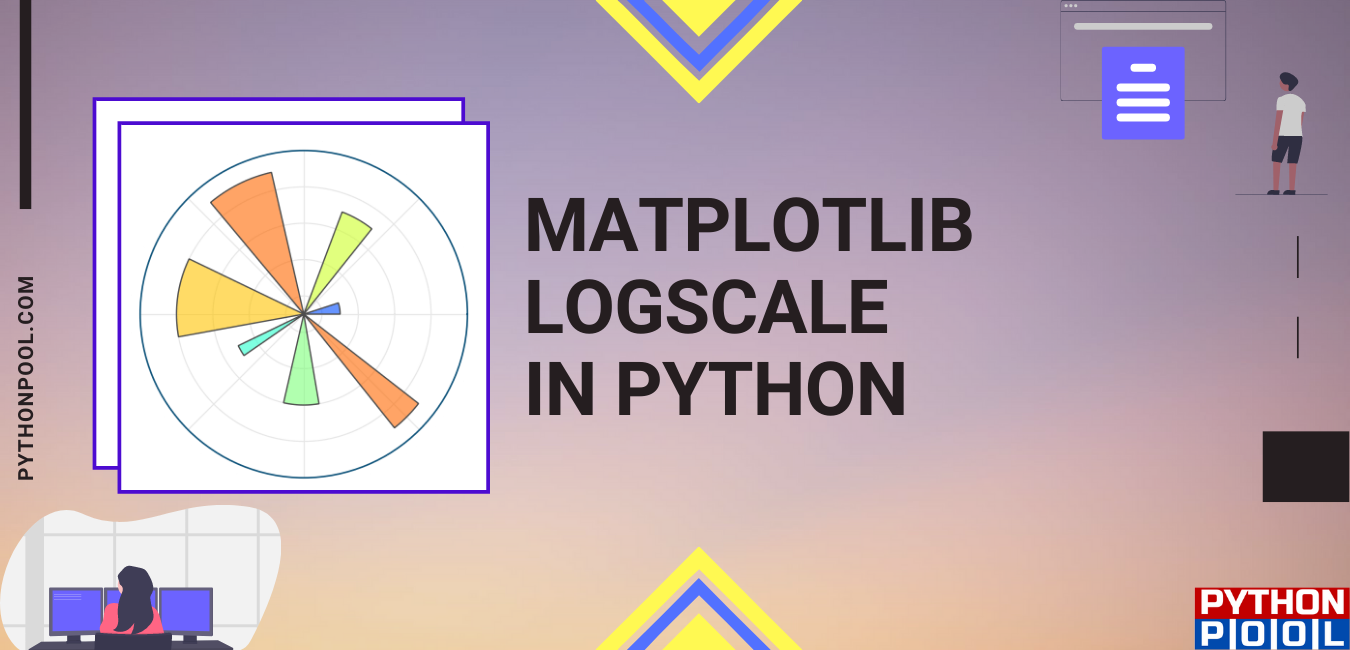
Hello programmers, in today’s article, we will learn about the Matplotlib Logscale in Python. Matplotlib log scale is a scale having powers of 10. You …

In this article, we will discuss the Matplotlib xticks() in Python. Matplotlib library in Python is a numerical – mathematical extension for NumPy library. The Pyplot function of …

Hello programmers, we will discuss the Matplotlib cmap() in Python. First, the Matplotlib library has several built-in colormaps available via the cmap() function. Pyplot module of the …
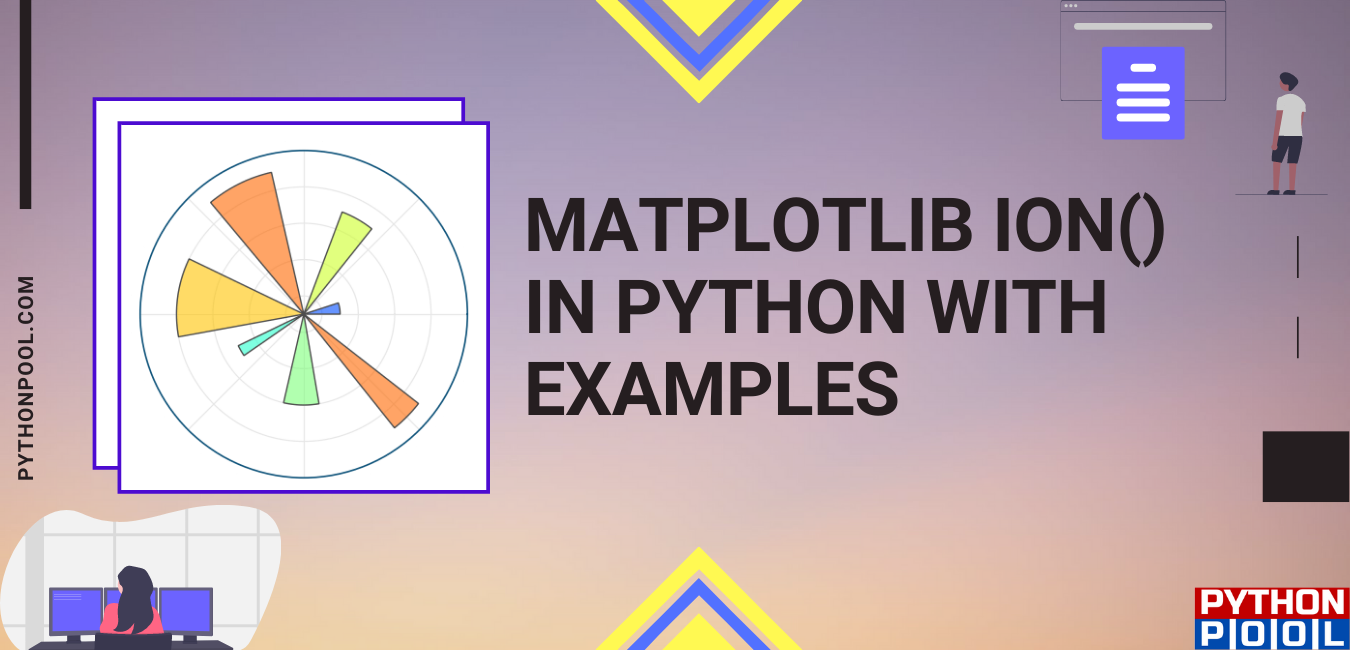
In this article, Hello programmers, we will discuss the Matplotlib ion in Python. Matplotlib is a multi-platform data visualization library using NumPy array. The Pyplot …
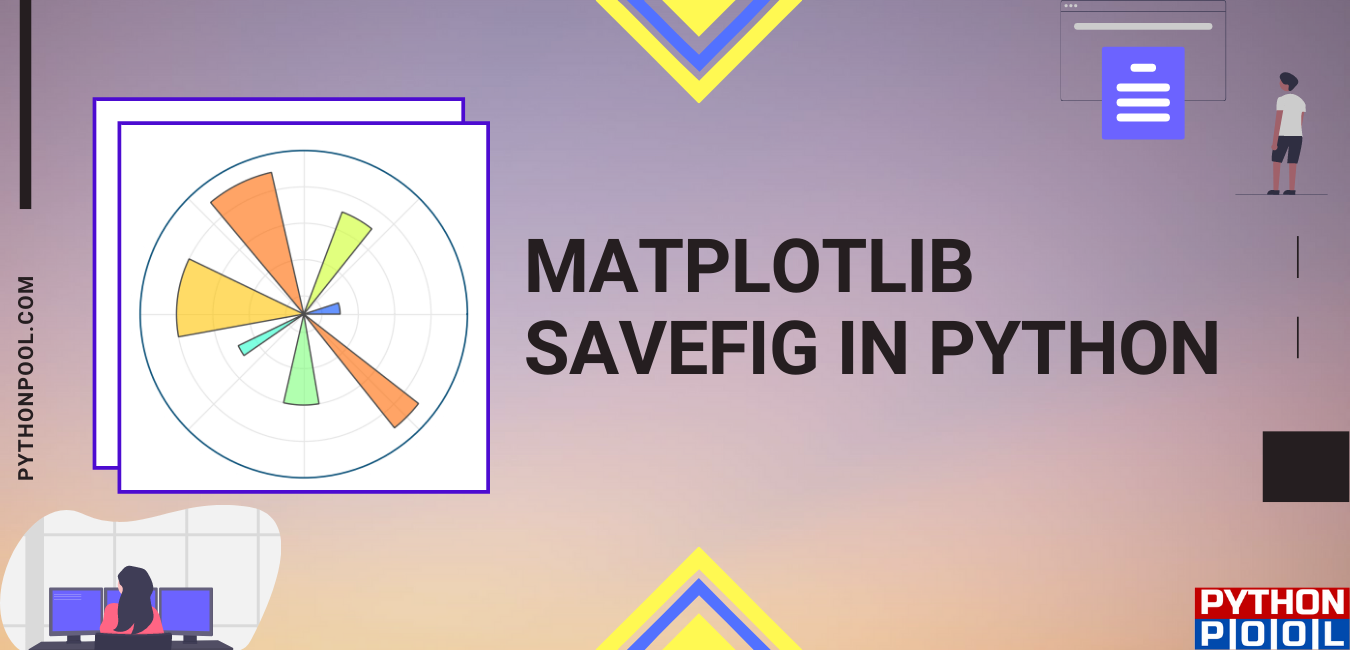
Hello programmers, in this article, we will study the Matplotlib savefig() in python. As we all know, Matplotlib is a beneficial visualization library in python, …
In this article, we learn about the Matplotlib errorbar in Python. The Pyplot module of the Matplotlib library provides MATLAB-like interface. And the matplotlib.pyplot.errorbar() function …