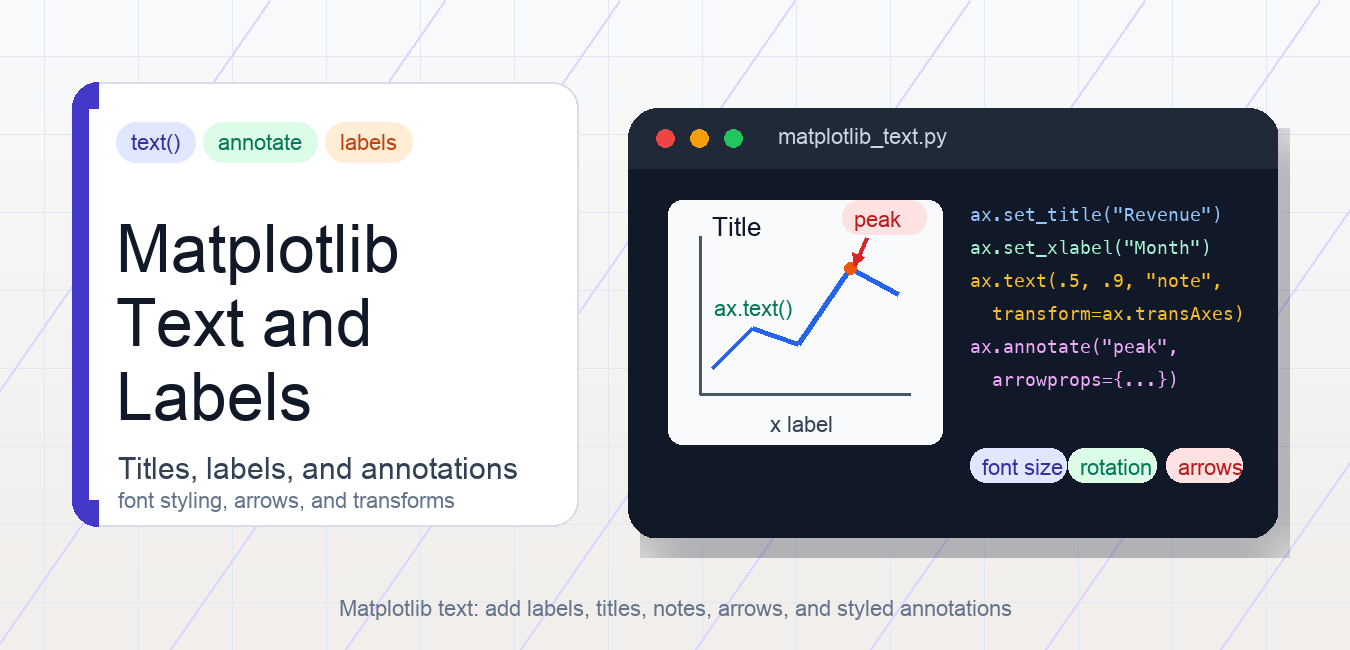
Quick answer: Choose the Matplotlib text method based on what the label should follow. Use set_title(), set_xlabel(), and set_ylabel() for plot structure, ax.text() for a short note at data or axes coordinates, and ax.annotate() when the note points to a target. Keep labels short, set alignment explicitly, and inspect the exported figure for clipping.
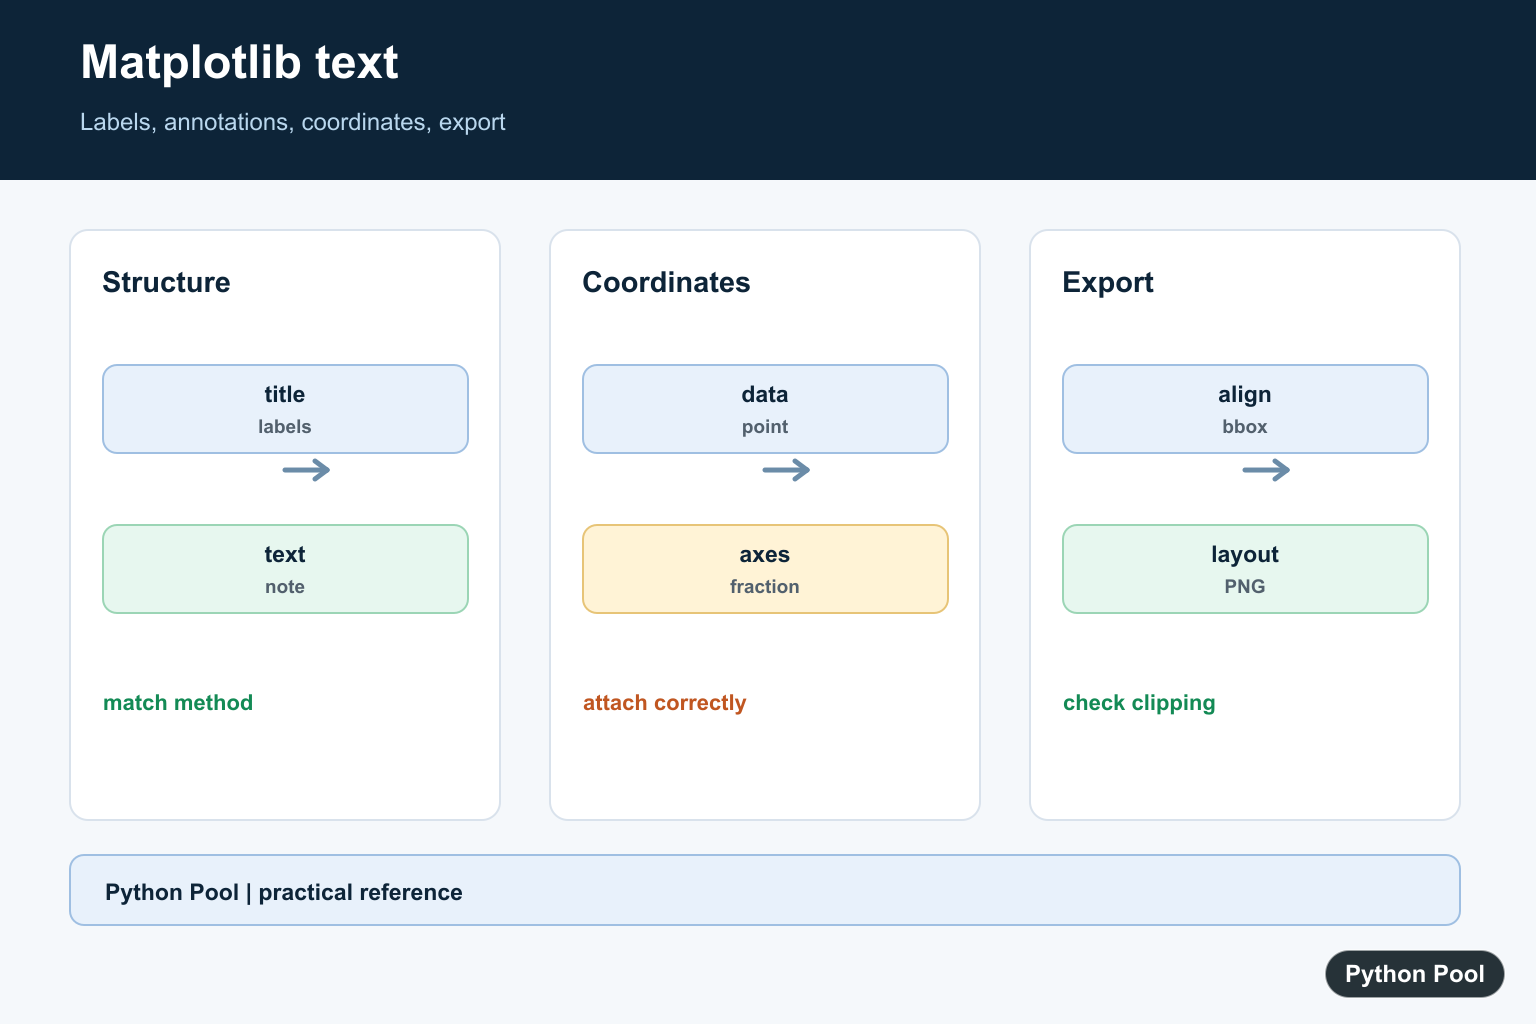
Matplotlib text tools let you add titles, axis labels, notes, annotations, and arrows to Python plots. The most common methods are ax.text(), ax.set_title(), ax.set_xlabel(), ax.set_ylabel(), and ax.annotate().
Use text when it helps the reader understand the chart. A good label explains the axis, a good annotation points to a specific event or value, and a good title states what the figure shows. Avoid filling the plot area with long paragraphs; that usually makes the chart harder to read.
Add text at data coordinates
ax.text(x, y, s) places text at a location in data coordinates by default. That means the text moves with the plotted data when axis limits change.
import matplotlib.pyplot as plt

fig, ax = plt.subplots()
ax.plot([1, 2, 3], [2, 4, 3])

ax.text(2, 4, "peak", fontsize=12, color="crimson")
plt.show()
Use this pattern when the note belongs to a specific data point. If you need an arrow pointing to the same point, annotate() is usually better than plain text().
Add title and axis labels
Titles and axis labels have dedicated methods. They are clearer than manually positioning text near the axes.
ax.set_title("Monthly revenue", fontsize=14, fontweight="bold")
ax.set_xlabel("Month")
ax.set_ylabel("Revenue")
Use labels to describe units and meaning, not just variable names. If tick labels are the problem, see Matplotlib xticks and Matplotlib ylim for axis-specific cleanup.
Place text relative to the axes
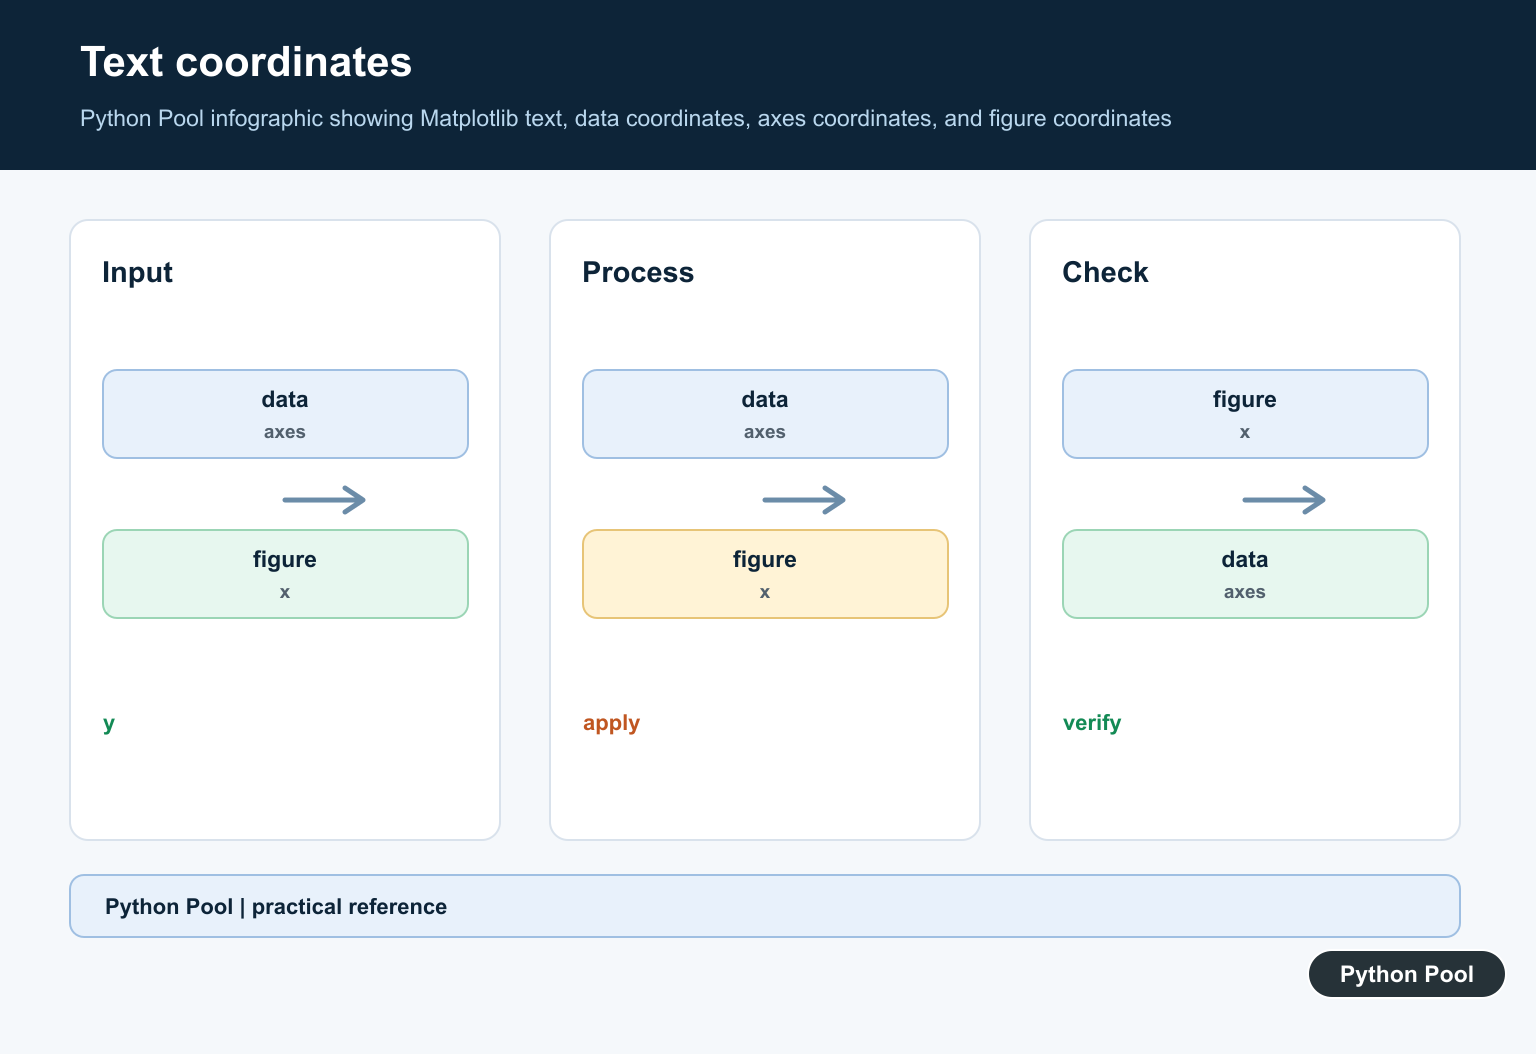
Sometimes text should stay in the same corner of the axes even if the data range changes. Use transform=ax.transAxes. In axes coordinates, (0, 0) is the bottom-left corner and (1, 1) is the top-right corner.
ax.text(
    0.02,
    0.95,
    "Draft",
    transform=ax.transAxes,
    va="top",
    fontsize=11,
)
This is useful for panel labels, watermarks, sample-size notes, or short status labels. Axes-relative text is easier to maintain than guessing a data coordinate that happens to appear in the corner.
Add annotations with arrows
ax.annotate() combines text with a target point. xy is the point being annotated, and xytext is where the label appears.
ax.annotate(
    "peak",
    xy=(2, 4),
    xytext=(2.2, 4.4),
    arrowprops={"arrowstyle": "->"},
)
Annotations are best for outliers, peaks, threshold crossings, and events that need an explanation. For a deeper annotation walkthrough, see Matplotlib annotate(). For arrow-specific styling, see Matplotlib arrows.
Style text with font properties
Most text methods accept common font and alignment properties. Useful options include fontsize, fontweight, color, ha, va, rotation, and bbox.
ax.text(
    2,
    4,
    "Peak value",
    fontsize=12,
    fontweight="bold",
    color="white",
    bbox={"boxstyle": "round", "facecolor": "crimson"},
)
Use a bounding box when text needs contrast against a busy plot. Use rotation sparingly; rotated labels can be hard to read. If labels collide with each other or the figure edge, fix spacing with Matplotlib subplot spacing before exporting.
Layering and readability
Text is an artist in Matplotlib, so it can be layered with zorder. If text appears behind a line, marker, image, or grid, raise its zorder. If the background is too busy, reduce visual clutter or add a small text box.
Grid lines, background colors, and export settings also affect readability. Related guides include Matplotlib grid, Matplotlib background color, Matplotlib zorder, and Matplotlib savefig().
Common mistakes
Do not use ax.text() for axis labels or titles when dedicated methods exist. Do not put long notes inside the plot area. Do not place important text at hard-coded data coordinates if the axis limits may change. Do not forget to check the exported image, because text that looks fine in a notebook can be clipped in a saved PNG or PDF.
Another common mistake is mixing coordinate systems without noticing. Text placed in data coordinates follows the data. Text placed with ax.transAxes follows the axes box. Text placed in figure coordinates follows the whole figure. Choose the coordinate system based on what the text should stay attached to.
Quick decision guide
Use set_title(), set_xlabel(), and set_ylabel() for structural labels. Use text() for short notes that do not need arrows. Use annotate() when the note points to a specific point. Use axes coordinates for corner labels and data coordinates for labels tied to data values.
For vector fields and arrow-like data, text annotations are not the same as a quiver plot. If you are plotting directions or magnitudes as arrows, see Matplotlib quiver.
Official Matplotlib references
- pyplot.text documentation
- Axes.text documentation
- Axes.annotate documentation
- Matplotlib text API
- Text properties guide
- Annotations guide
- Transforms tutorial
- Axes.set_title documentation
- Axes.set_xlabel documentation
Pick The Correct Coordinate System
Data coordinates attach a note to a value, while axes coordinates keep it in a stable place inside the axes box. Use transform=ax.transAxes for a corner label and document the choice when a reader might otherwise mistake the coordinates.
import matplotlib.pyplot as plt

fig, ax = plt.subplots()
ax.plot([1, 2, 3], [2, 4, 3])
ax.text(0.02, 0.96, "Draft", transform=ax.transAxes, va="top")
Use Alignment And A Small Bbox
ha and va control which part of the text is anchored to the coordinate. A small bbox can preserve contrast over a busy line, but it should support the plot rather than become a large panel that covers data.
ax.text(2, 4, "peak", ha="center", va="bottom", bbox={"facecolor": "white", "alpha": 0.8, "pad": 3})
Layer Text With zorder
Text is a Matplotlib artist and can be layered with zorder. Raise it when it is hidden behind a line or image, but first consider whether moving the label or reducing visual clutter would be clearer than stacking more elements.
ax.text(2, 4, "important", color="crimson", zorder=5)
Export Without Clipping
Notebook display can hide export problems. Use constrained layout or tight_layout where appropriate, leave room for long labels, and inspect the saved PNG or PDF at its final dimensions. Avoid hard-coded data coordinates for labels that must remain in a corner as the data range changes.
fig, ax = plt.subplots(figsize=(6, 4), constrained_layout=True)
ax.set_title("A title that fits the exported figure")
fig.savefig("plot.png", dpi=160, bbox_inches="tight")
See the official Axes.text reference, Axes.annotate reference, and text properties guide. The related subplot spacing guide helps when labels need more room.
For related chart labels and layout, compare Matplotlib annotate(), vertical plot markers, and grid styling when making a figure readable at export size.
Frequently Asked Questions
How do I add text to a Matplotlib plot?
Use ax.text(x, y, text) for a note at data coordinates, or use set_title, set_xlabel, and set_ylabel for structural labels.
What is the difference between data and axes coordinates?
Data coordinates move with the plotted values, while axes coordinates use the axes box from 0 to 1 and keep a note in a stable relative position.
When should I use annotate instead of text?
Use annotate when the note explains a specific point and benefits from a connector or arrow between the label and its target.
Why is Matplotlib text clipped in a saved image?
The label may extend outside the figure or collide with layout bounds; use constrained layout or tight bounding-box export and inspect the final file.